
+6.67% for American Airlines stock as LAX runs smoothly during peak travel

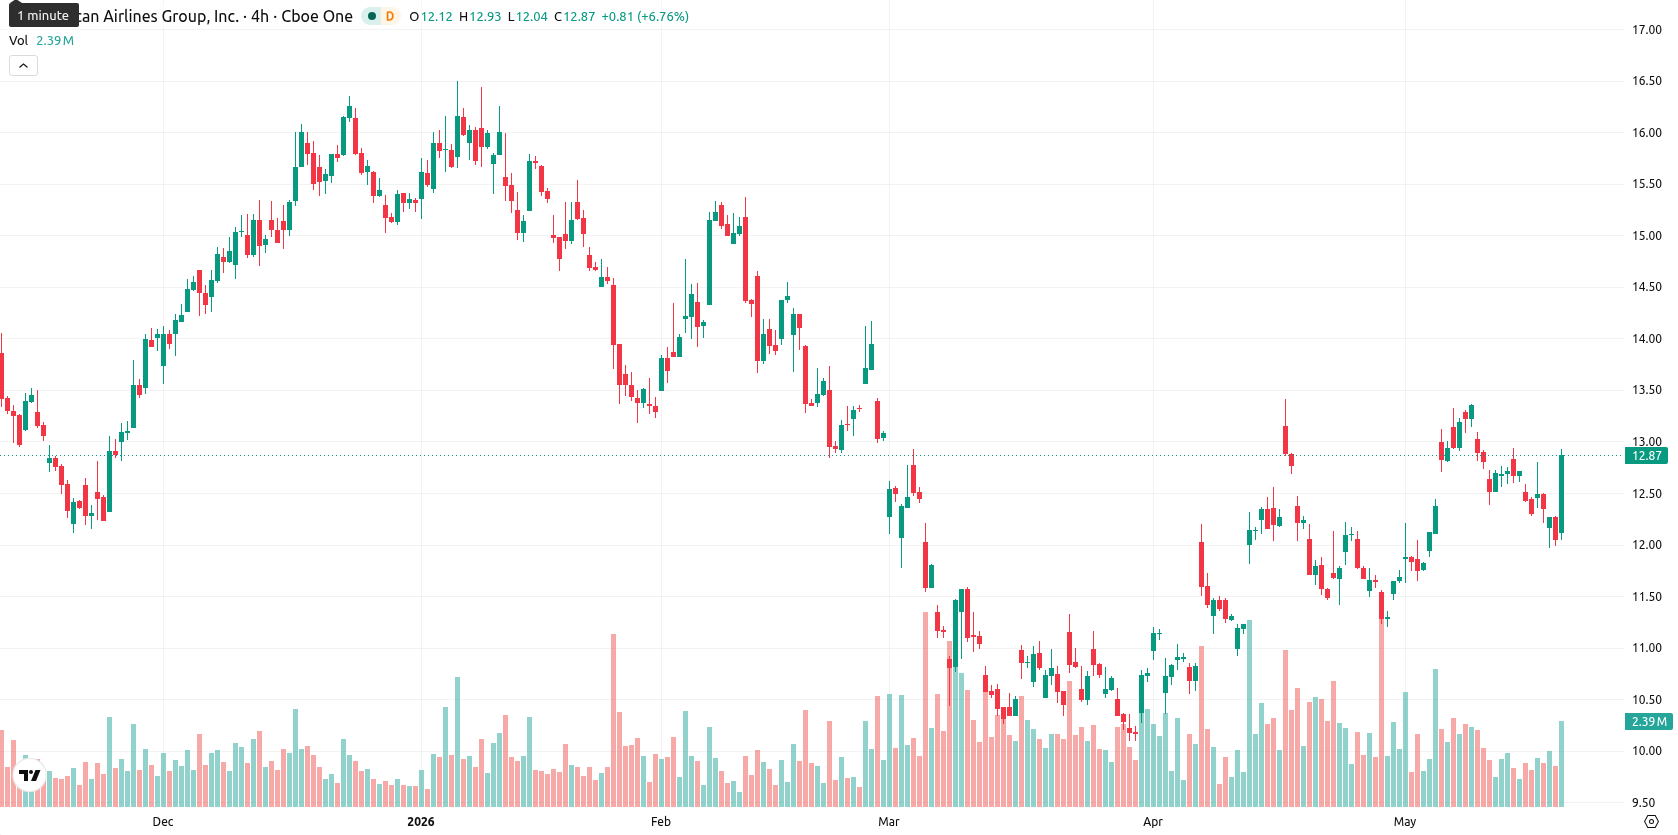
American Airlines Group (AAL) is trading at $12.87, marking a 6.67% gain for the day. The price is above its key short- and medium-term moving averages but remains just below long-term levels.
Highlights
- American Airlines maintains stable operations and existing capacity at LAX for June 2026 to capture consistent summer travel demand.
- The airline focuses on reliability and operational efficiency at Los Angeles, reinforcing steady passenger flows and network-driven revenue.
- Technically, AAL shows short-term bullish momentum but faces strong resistance near $13.18, with a likely consolidation range of $12.20 to $13.18 and downside risk if support fails.
Stable passenger flows at LAX as network capacity remains steady
American Airlines is maintaining stable operations at Los Angeles International Airport for June 2026, electing not to add new routes this month. This approach preserves existing capacity and leverages consistent demand as the travel season intensifies, with government sources confirming efforts to optimize service reliability and operational efficiency. Continued frequent scheduling and dependable connectivity at LAX contribute to steady passenger flow during the peak summer period, reinforcing revenue streams through sustained network execution.
Bullish MACD diverges from weak momentum at major resistance
The $12.87 price level places AAL above the MA-20 ($12.24) and MA-50 ($11.56), while remaining just under the MA-200 ($12.97). The Ichimoku Kijun sits at $12.29, now functioning as immediate support. MACD on the daily chart signals strong bullish momentum, yet ADX remains neutral, highlighting a trend lacking strength. RSI is at 47.90 and CCI is neutral, both indicating persisting weakness, while Stoch RSI suggests oversold conditions that could support a short-term rebound. BBP remains negative, reflecting modest seller dominance, and the Awesome Oscillator is neutral. Trading near session highs with high volatility, the latest session features a notable divergence: strong MACD and oversold Stoch RSI against neutral trend indicators and a sub-50 RSI.
Sideways trading likely as resistance and weak momentum cap upside
Looking to the week ahead, AAL is likely to consolidate within a typical volatility band between $12.20 and $13.18. Persistent resistance from the MA-200 and a predominantly negative momentum profile on the weekly timeframe suggest a low probability of sustained upside, estimated below 20%. The baseline scenario is for the price to move sideways between the $12.29 immediate support and recent highs. Upside would require a firm breakout above $13.18, whereas a decline below $12.20 could trigger a test of lower support if selling resumes.
Earlier, analysts noted that American Airlines stock was demonstrating short-term bullish momentum, but faced persistent resistance and lacked clear directional conviction. The latest operational stability at LAX, combined with ongoing technical divergence, now adds a layer of support for near-term consolidation, making investor focus on a sustained move above the long-term moving average pivotal for any meaningful upside.


Latest American Airlines News


-
 Afghanistan
-
 Albania
-
 Algeria
-
 Angola
-
 Argentina
-
 Armenia
-
 Australia
-
 Austria
-
 Azerbaijan
-
 Bahamas
-
 Bahrain
-
 Bangladesh
-
 Belarus
-
 Belgium
-
 Bolivia
-
 Botswana
-
 Brazil
-
 Brunei
-
 Bulgaria
-
 Cambodia
-
 Cameroon
-
 Canada
-
 Chile
Chile
-
 China
China
-
 Colombia
-
 Congo
Congo
-
 Costa Rica
-
 Cote d'Ivoire
-
 Croatia
-
 Cuba
Cuba
-
 Cyprus
-
 Czechia
-
 DR Congo
-
 Denmark
-
 Dominican Republic
-
 Ecuador
-
 Egypt
Egypt
-
 El Salvador
-
 Estonia
-
 Eswatini
-
 Ethiopia
-
 Finland
-
 France
-
 Georgia
-
 Germany
-
 Ghana
Ghana
-
 Greece
-
 Haiti
Haiti
-
 Hong Kong
-
 Hungary
-
 India
India
-
 Indonesia
-
 Iran, Islamic republic
-
 Iraq
Iraq
-
 Ireland
-
 Israel
-
 Italy
Italy
-
 Jamaica
-
 Japan
Japan
-
 Jordan
-
 Kazakhstan
-
 Kenya
Kenya
-
 Korea
Korea
-
 Kuwait
-
 Kyrgyzstan
-
 Laos
Laos
-
 Latvia
-
 Lebanon
-
 Lesotho
-
 Libya
Libya
-
 Lithuania
-
 Luxembourg
-
 Madagascar
-
 Malaysia
-
 Malta
Malta
-
 Mauritius
-
 Mexico
-
 Moldova
-
 Mongolia
-
 Montenegro
-
 Morocco
-
 Mozambique
-
 Myanmar
-
 Namibia
-
 Nepal
Nepal
-
 Netherlands
-
 New Zealand
-
 Nigeria
-
 North Macedonia
-
 Norway
-
 Oman
Oman
-
 Pakistan
-
 Palestine
-
 Panama
-
 Papua New Guinea
-
 Paraguay
-
 Peru
Peru
-
 Philippines
-
 Poland
-
 Portugal
-
 Puerto Rico
-
 Qatar
Qatar
-
 Reunion
-
 Romania
-
 Rwanda
-
 Saudi Arabia
-
 Serbia
-
 Singapore
-
 Slovakia
-
 Slovenia
-
 Somalia
-
 South Africa
-
 Spain
Spain
-
 Sri Lanka
-
 Sweden
-
 Switzerland
-
 Syria
Syria
-
 Taiwan
-
 Tajikistan
-
 Tanzania
-
 Thailand
-
 Trinidad and Tobago
-
 Tunisia
-
 Turkey
-
 UAE
UAE
-
 Uganda
-
 Ukraine
-
 United Kingdom
-
United States
-
 Uruguay
-
 Uzbekistan
-
 Venezuela
-
 Vietnam
-
 Yemen
Yemen
-
 Zambia
-
 Zimbabwe
- Forex
- Crypto
