
Why is American Airlines stock down today? Seller pressure weighs as FAA extends O'Hare flight cuts

American Airlines (AAL) stock is trading at $15.76 after a 3.37% decline on the day, closing near its session lows. The price now sits below its key moving averages, with a negative daily momentum.
 16.30
17.38
16.30
17.38
Highlights
- American Airlines plans major international expansion in 2026 with 13 new overseas routes from key US hubs.
- Operational headwinds persist as the FAA extends 10% flight reduction at Chicago O'Hare through 2027, affecting capacity.
- Technical signals are distinctly bearish with price likely to consolidate between $15.19 and $16.33 amid strong downside momentum.
Expansion plans tempered by FAA constraints and persistent stock pressure
American Airlines is set to expand its global network in 2026 by adding 13 new international routes connecting major US hubs with Europe, Canada, the Caribbean, and South America, a move confirmed by Travelandtourworld. While this expansion increases available capacity and could enhance route competitiveness in future years, investor attention remains partially focused on operational constraints after the FAA extended a 10% reduction in flights at Chicago O'Hare until 2027, as reported by Thetravel. Additionally, American Airlines and Starlux Airlines jointly filed for US regulatory approval to establish a codeshare agreement, aiming to deepen Taiwan-US connections in the long term. These developments highlight company efforts to grow international reach, though price action has remained under broader selling pressure.
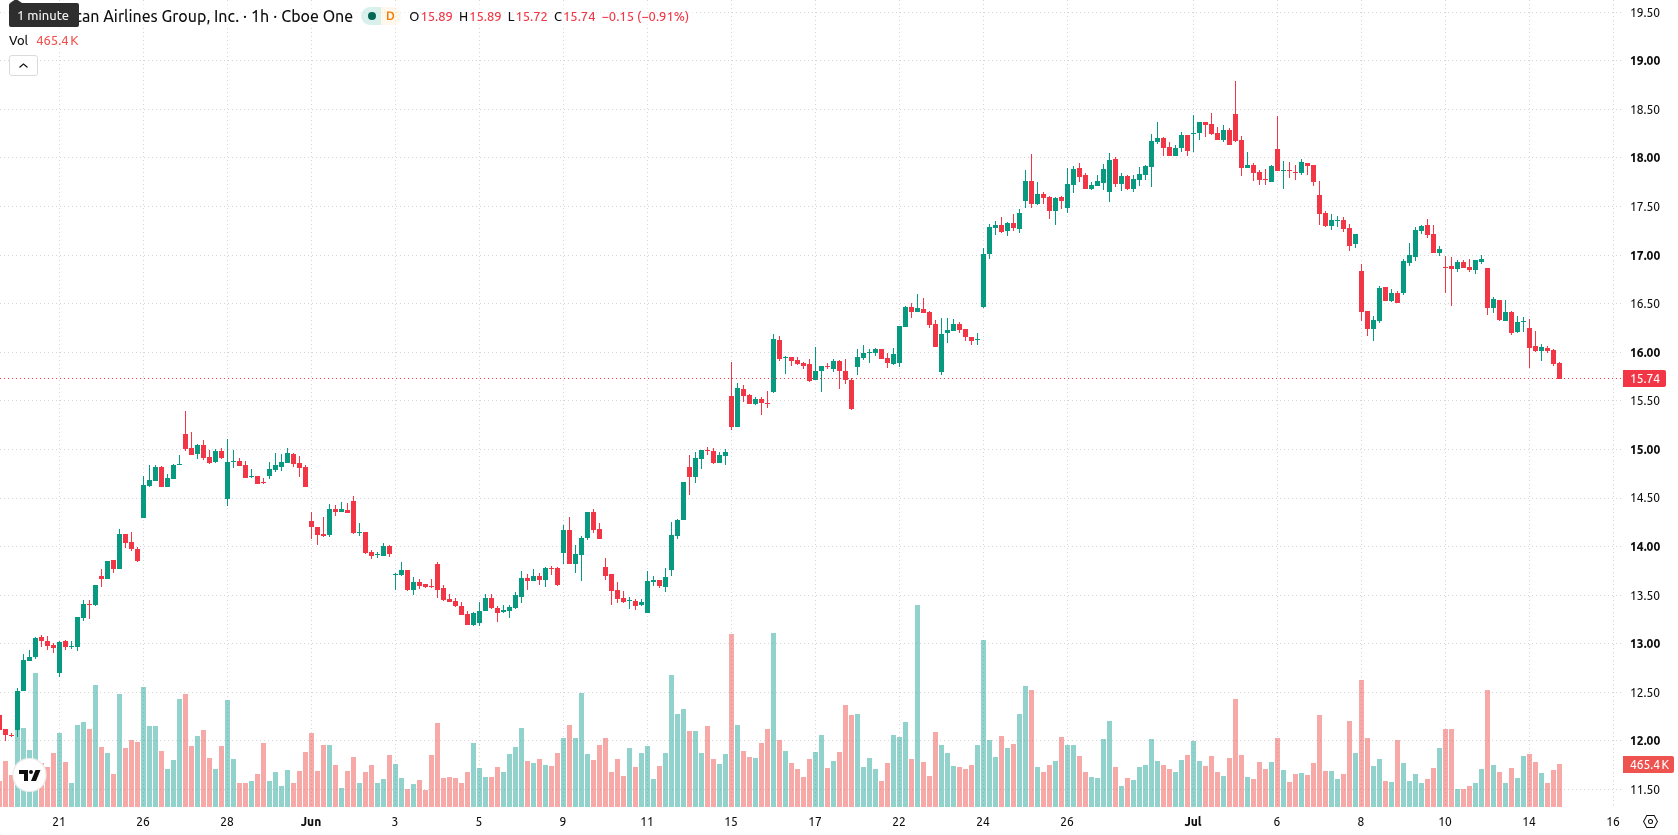
Bearish momentum persists as price tests oversold support zones
Technically, AAL is trading below the 20-period ($16.44) and 50-period ($16.91) moving averages on the hourly chart, but remains above the 200-period moving average ($13.48) on the daily timeframe. Immediate resistance is identified at the Ichimoku Kijun level of $16.6, while key support lies at $15.19. Momentum readings remain negative: the Moving Average Convergence Divergence (MACD) and Average Directional Index (ADX) confirm strong bearish strength, the Relative Strength Index (RSI) is deep in oversold territory at 27.47, and both Stochastic RSI and Commodity Channel Index (CCI) are similarly oversold. Bull/Bear Power signals intraday seller dominance, and the Awesome Oscillator confirms the prevailing downtrend.
Low breakout odds as volatility anchors price to narrow band
Over the coming days, the price is anticipated to consolidate within the $15.19–$16.33 band, reflecting typical volatility against the current backdrop. Probability of a sustained upward breakout is very low, with downside risk remaining elevated. A sustained move above $16.6 would be required to catalyze a bullish scenario, whereas a break below the $15.19 support level could trigger accelerated declines.
Previously it was reported that American Airlines faced heightened downside risk as technicals turned increasingly bearish amid ongoing regulatory constraints. The current market environment reinforces this negative outlook, with persistent selling keeping investors focused on whether the $15.19 support can hold as the next critical test for sentiment.


Latest American Airlines News






-
 Afghanistan
-
 Albania
-
 Algeria
-
 Angola
-
 Argentina
-
 Armenia
-
 Australia
-
 Austria
-
 Azerbaijan
-
 Bahamas
-
 Bahrain
-
 Bangladesh
-
 Belarus
-
 Belgium
-
 Bolivia
-
 Botswana
-
 Brazil
-
 Brunei
-
 Bulgaria
-
 Cambodia
-
 Cameroon
-
 Canada
-
 Chile
Chile
-
 China
China
-
 Colombia
-
 Congo
Congo
-
 Costa Rica
-
 Cote d'Ivoire
-
 Croatia
-
 Cuba
Cuba
-
 Cyprus
-
 Czechia
-
 DR Congo
-
 Denmark
-
 Dominican Republic
-
 Ecuador
-
 Egypt
Egypt
-
 El Salvador
-
 Estonia
-
 Eswatini
-
 Ethiopia
-
 Finland
-
 France
-
 Georgia
-
 Germany
-
 Ghana
Ghana
-
 Greece
-
 Haiti
Haiti
-
 Hong Kong
-
 Hungary
-
 India
India
-
 Indonesia
-
 Iran, Islamic republic
-
 Iraq
Iraq
-
 Ireland
-
 Israel
-
 Italy
Italy
-
 Jamaica
-
 Japan
Japan
-
 Jordan
-
 Kazakhstan
-
 Kenya
Kenya
-
 Korea
Korea
-
 Kuwait
-
 Kyrgyzstan
-
 Laos
Laos
-
 Latvia
-
 Lebanon
-
 Lesotho
-
 Libya
Libya
-
 Lithuania
-
 Luxembourg
-
 Madagascar
-
 Malaysia
-
 Malta
Malta
-
 Mauritius
-
 Mexico
-
 Moldova
-
 Mongolia
-
 Montenegro
-
 Morocco
-
 Mozambique
-
 Myanmar
-
 Namibia
-
 Nepal
Nepal
-
 Netherlands
-
 New Zealand
-
 Nigeria
-
 North Macedonia
-
 Norway
-
 Oman
Oman
-
 Pakistan
-
 Palestine
-
 Panama
-
 Papua New Guinea
-
 Paraguay
-
 Peru
Peru
-
 Philippines
-
 Poland
-
 Portugal
-
 Puerto Rico
-
 Qatar
Qatar
-
 Reunion
-
 Romania
-
 Rwanda
-
 Saudi Arabia
-
 Serbia
-
 Singapore
-
 Slovakia
-
 Slovenia
-
 Somalia
-
 South Africa
-
 Spain
Spain
-
 Sri Lanka
-
 Sweden
-
 Switzerland
-
 Syria
Syria
-
 Taiwan
-
 Tajikistan
-
 Tanzania
-
 Thailand
-
 Trinidad and Tobago
-
 Tunisia
-
 Turkey
-
 UAE
UAE
-
 Uganda
-
 Ukraine
-
 United Kingdom
-
United States
-
 Uruguay
-
 Uzbekistan
-
 Venezuela
-
 Vietnam
-
 Yemen
Yemen
-
 Zambia
-
 Zimbabwe
- Forex
- Crypto











