
-4.37% for The Trade Desk stock as sellers dominate the trend

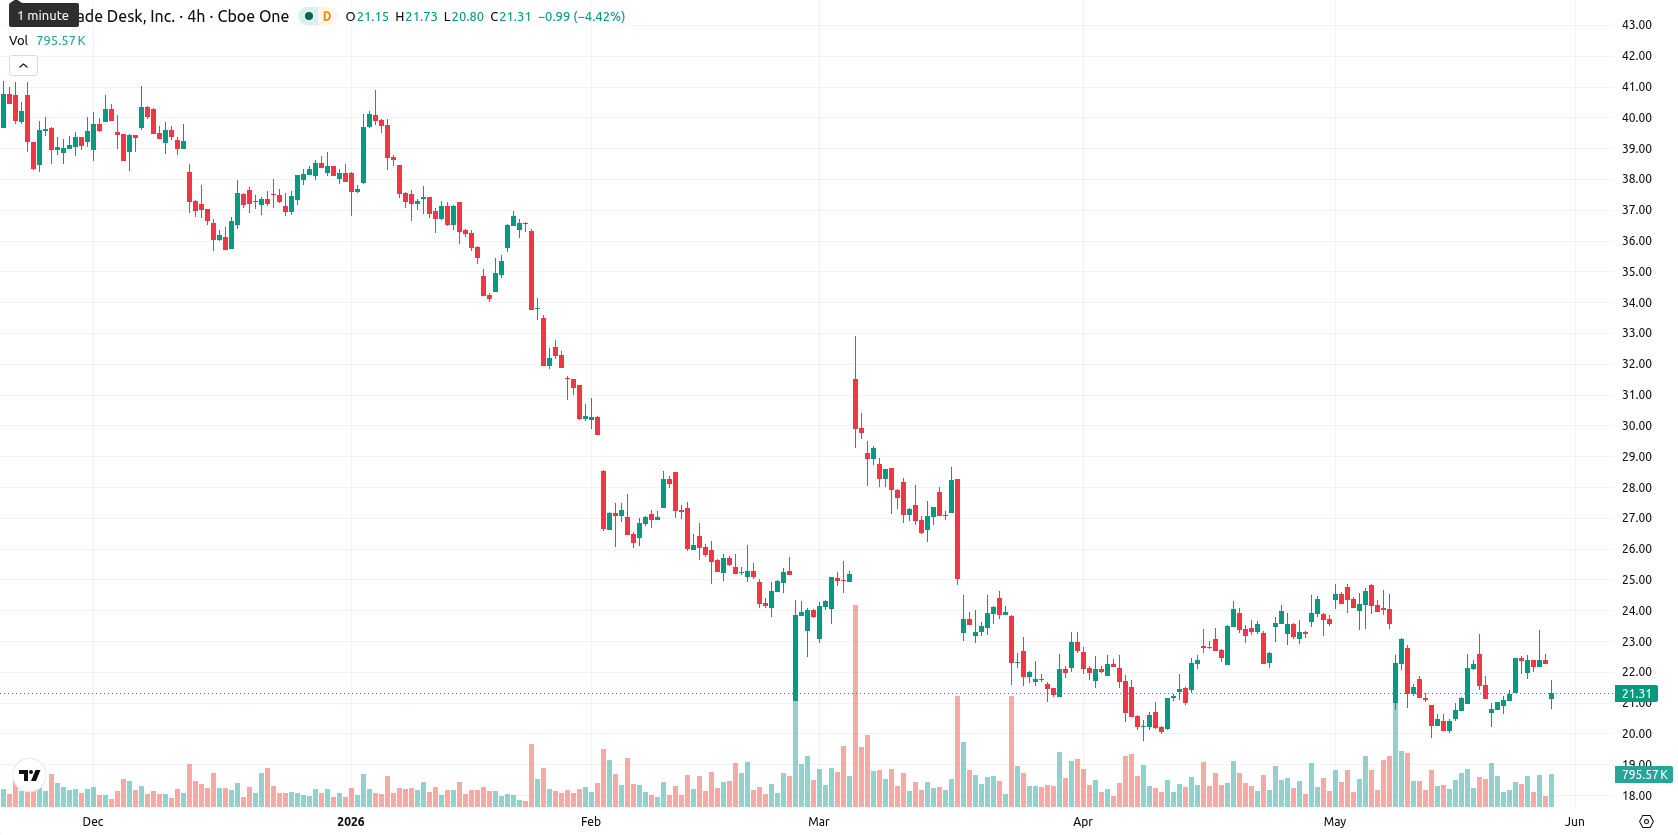
The Trade Desk (TTD) stock is trading at $21.32, down 4.37% on the day. The shares are currently positioned below their key moving averages amid heightened volatility.
Highlights
- TTD trades below all major moving averages across timeframes, confirming persistent bearish pressure and weak momentum.
- Technical indicators remain decisively bearish, with MACD, ADX, and RSI signaling increased downside risk despite some short-term volatility.
- Baseline projection sees TTD ranging between $20.50 and $22.90 for the next week, with downside bias and less than 20% probability of sustained recovery.
Sustained downside risk as sell signals meet support tests
On the technical front, TTD is trading below the SMA-20 at $22.44, SMA-50 at $22.45, and well beneath the SMA-200 at $36.37. The Ichimoku Kijun at $22.34 now forms immediate overhead resistance. The daily MACD indicates a strong sell signal, while ADX remains neutral. RSI sits just below 50, suggesting potential for further decline. Stoch RSI and Bull/Bear Power (BBP) both reflect an overbought condition and strong buyer dominance, yet the Commodity Channel Index (CCI) and Awesome Oscillator (AO) are neutral. The session began with a gap down from the previous close ($22.29 to $21.05), and the price has hovered near the day's low of the $20.90 to $21.71 range, highlighting continued intraday pressure.
Sideways bias favored as volatility brackets short-term moves
Over the next five trading days, TTD is expected to remain within a volatility band of $20.50 to $22.90. A breakout above $22.90 would require clear improvement in momentum indicators, initially targeting resistance at $23.00. Conversely, a drop below $20.50 could pave the way for additional declines if momentum does not shift positive and support levels fail. The base case scenario is continued sideways movement within the defined band.
Earlier, analysts noted that The Trade Desk was facing persistent technical pressures and a broadly cautious outlook despite intermittent signals of institutional support. The latest price decline and continued weakness in momentum indicators reinforce the bearish scenario, making a sustained move above the $22.90 resistance a critical signal for any potential reversal.


Latest The Trade Desk News


-
 Afghanistan
-
 Albania
-
 Algeria
-
 Angola
-
 Argentina
-
 Armenia
-
 Australia
-
 Austria
-
 Azerbaijan
-
 Bahamas
-
 Bahrain
-
 Bangladesh
-
 Belarus
-
 Belgium
-
 Bolivia
-
 Botswana
-
 Brazil
-
 Brunei
-
 Bulgaria
-
 Cambodia
-
 Cameroon
-
 Canada
-
 Chile
Chile
-
 China
China
-
 Colombia
-
 Congo
Congo
-
 Costa Rica
-
 Cote d'Ivoire
-
 Croatia
-
 Cuba
Cuba
-
 Cyprus
-
 Czechia
-
 DR Congo
-
 Denmark
-
 Dominican Republic
-
 Ecuador
-
 Egypt
Egypt
-
 El Salvador
-
 Estonia
-
 Eswatini
-
 Ethiopia
-
 Finland
-
 France
-
 Georgia
-
 Germany
-
 Ghana
Ghana
-
 Greece
-
 Haiti
Haiti
-
 Hong Kong
-
 Hungary
-
 India
India
-
 Indonesia
-
 Iran, Islamic republic
-
 Iraq
Iraq
-
 Ireland
-
 Israel
-
 Italy
Italy
-
 Jamaica
-
 Japan
Japan
-
 Jordan
-
 Kazakhstan
-
 Kenya
Kenya
-
 Korea
Korea
-
 Kuwait
-
 Kyrgyzstan
-
 Laos
Laos
-
 Latvia
-
 Lebanon
-
 Lesotho
-
 Libya
Libya
-
 Lithuania
-
 Luxembourg
-
 Madagascar
-
 Malaysia
-
 Malta
Malta
-
 Mauritius
-
 Mexico
-
 Moldova
-
 Mongolia
-
 Montenegro
-
 Morocco
-
 Mozambique
-
 Myanmar
-
 Namibia
-
 Nepal
Nepal
-
 Netherlands
-
 New Zealand
-
 Nigeria
-
 North Macedonia
-
 Norway
-
 Oman
Oman
-
 Pakistan
-
 Palestine
-
 Panama
-
 Papua New Guinea
-
 Paraguay
-
 Peru
Peru
-
 Philippines
-
 Poland
-
 Portugal
-
 Puerto Rico
-
 Qatar
Qatar
-
 Reunion
-
 Romania
-
 Rwanda
-
 Saudi Arabia
-
 Serbia
-
 Singapore
-
 Slovakia
-
 Slovenia
-
 Somalia
-
 South Africa
-
 Spain
Spain
-
 Sri Lanka
-
 Sweden
-
 Switzerland
-
 Syria
Syria
-
 Taiwan
-
 Tajikistan
-
 Tanzania
-
 Thailand
-
 Trinidad and Tobago
-
 Tunisia
-
 Turkey
-
 UAE
UAE
-
 Uganda
-
 Ukraine
-
 United Kingdom
-
United States
-
 Uruguay
-
 Uzbekistan
-
 Venezuela
-
 Vietnam
-
 Yemen
Yemen
-
 Zambia
-
 Zimbabwe
- Forex
- Crypto
