
Interactive Brokers stock price forecast: Watch $87.50 resistance as IBKR extends 3.52% climb

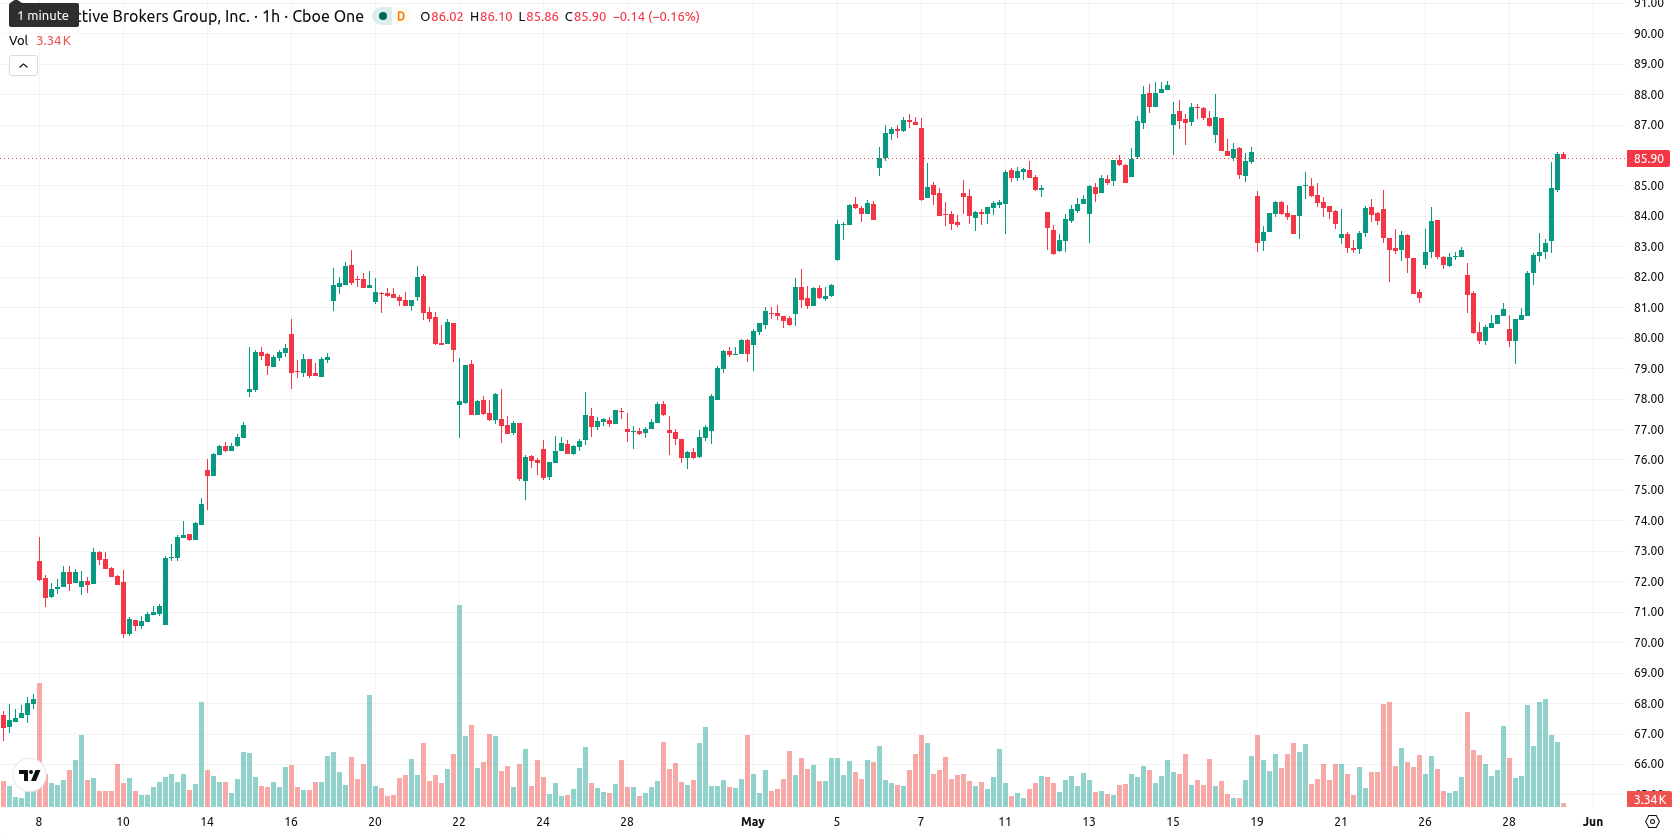
Interactive Brokers Group Inc. (IBKR) stock is trading at $86.04, up 3.52% today and holding above its key moving averages. The price demonstrates a strong move higher, supported by favorable positioning relative to both short- and long-term averages.
Highlights
- IBKR maintains a strong bullish trend, trading well above key moving average supports across all timeframes.
- Momentum indicators predominantly signal further upside, though some short-term overbought conditions and minor divergences are emerging.
- Expect IBKR to trade within the $84.00 to $87.50 range, with an 80%+ probability of price appreciation in the next five sessions.
Bullish technical signals amid mixed momentum and support at key level
IBKR is currently trading above the SMA-20 ($83.81), SMA-50 ($76.91), and SMA-200 ($70.24) with immediate support at the Ichimoku Kijun level on D1 of $81.53. Technical indicators are mixed: MACD (D1) and Stoch RSI both give strong buy signals, while RSI (53.68, Buy) reflects moderate momentum; CCI gives a mild sell, BBP (0.27, Oversold) points to buyer dominance intraday, and ADX and AO remain neutral, highlighting a blend of bullish momentum with minor divergences.
Bullish bias likely as volatility bands frame short-term risk
For the coming five sessions, IBKR is projected to fluctuate within a volatility band of $84.00 to $87.50. With an over 80% probability, the price is likely to continue rising, but a sideways scenario is also plausible near current levels. A bullish breakout above $87.50 could trigger further gains if strong momentum persists; conversely, a move below $84.00 would indicate a bearish shift, though underlying trend strength may limit further downside.
Earlier, analysts noted that despite some mixed momentum signals, the technical outlook for Interactive Brokers remained generally constructive, supported by its position above longer-term averages. With the stock now showing renewed strength and bullish signals dominating intraday, traders should watch for a confirmed breakout above $87.50 as a catalyst for further gains in the near term.


Latest Interactive Brokers News


-
 Afghanistan
-
 Albania
-
 Algeria
-
 Angola
-
 Argentina
-
 Armenia
-
 Australia
-
 Austria
-
 Azerbaijan
-
 Bahamas
-
 Bahrain
-
 Bangladesh
-
 Belarus
-
 Belgium
-
 Bolivia
-
 Botswana
-
 Brazil
-
 Brunei
-
 Bulgaria
-
 Cambodia
-
 Cameroon
-
 Canada
-
 Chile
Chile
-
 China
China
-
 Colombia
-
 Congo
Congo
-
 Costa Rica
-
 Cote d'Ivoire
-
 Croatia
-
 Cuba
Cuba
-
 Cyprus
-
 Czechia
-
 DR Congo
-
 Denmark
-
 Dominican Republic
-
 Ecuador
-
 Egypt
Egypt
-
 El Salvador
-
 Estonia
-
 Eswatini
-
 Ethiopia
-
 Finland
-
 France
-
 Georgia
-
 Germany
-
 Ghana
Ghana
-
 Greece
-
 Haiti
Haiti
-
 Hong Kong
-
 Hungary
-
 India
India
-
 Indonesia
-
 Iran, Islamic republic
-
 Iraq
Iraq
-
 Ireland
-
 Israel
-
 Italy
Italy
-
 Jamaica
-
 Japan
Japan
-
 Jordan
-
 Kazakhstan
-
 Kenya
Kenya
-
 Korea
Korea
-
 Kuwait
-
 Kyrgyzstan
-
 Laos
Laos
-
 Latvia
-
 Lebanon
-
 Lesotho
-
 Libya
Libya
-
 Lithuania
-
 Luxembourg
-
 Madagascar
-
 Malaysia
-
 Malta
Malta
-
 Mauritius
-
 Mexico
-
 Moldova
-
 Mongolia
-
 Montenegro
-
 Morocco
-
 Mozambique
-
 Myanmar
-
 Namibia
-
 Nepal
Nepal
-
 Netherlands
-
 New Zealand
-
 Nigeria
-
 North Macedonia
-
 Norway
-
 Oman
Oman
-
 Pakistan
-
 Palestine
-
 Panama
-
 Papua New Guinea
-
 Paraguay
-
 Peru
Peru
-
 Philippines
-
 Poland
-
 Portugal
-
 Puerto Rico
-
 Qatar
Qatar
-
 Reunion
-
 Romania
-
 Rwanda
-
 Saudi Arabia
-
 Serbia
-
 Singapore
-
 Slovakia
-
 Slovenia
-
 Somalia
-
 South Africa
-
 Spain
Spain
-
 Sri Lanka
-
 Sweden
-
 Switzerland
-
 Syria
Syria
-
 Taiwan
-
 Tajikistan
-
 Tanzania
-
 Thailand
-
 Trinidad and Tobago
-
 Tunisia
-
 Turkey
-
 UAE
UAE
-
 Uganda
-
 Ukraine
-
 United Kingdom
-
United States
-
 Uruguay
-
 Uzbekistan
-
 Venezuela
-
 Vietnam
-
 Yemen
Yemen
-
 Zambia
-
 Zimbabwe
- Forex
- Crypto
