
Hut 8 stock surges as buyers push price toward $133.16 resistance

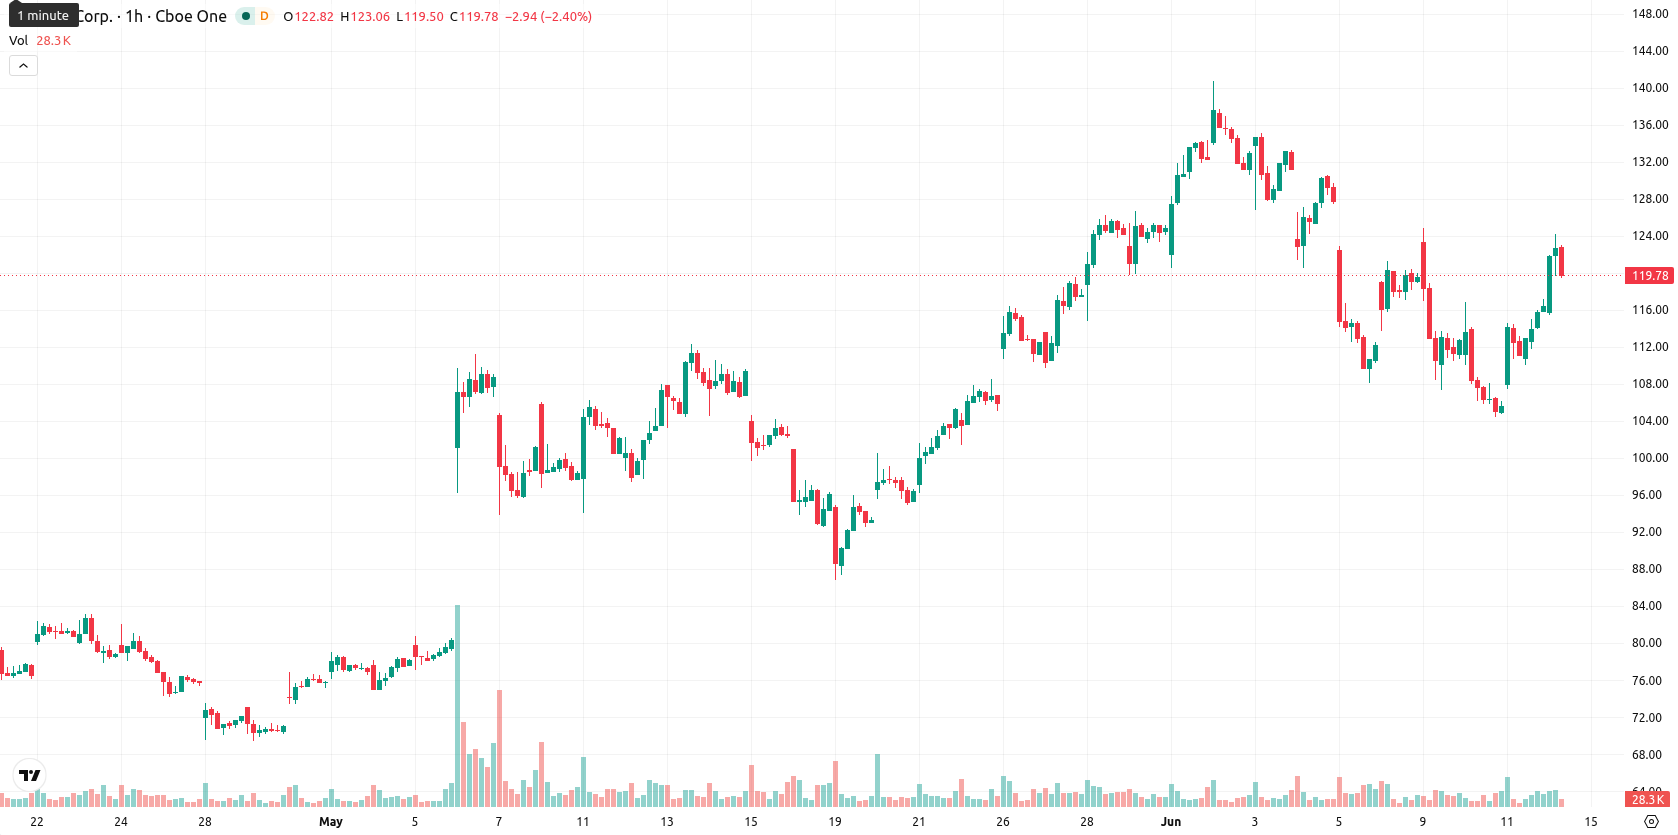
Hut 8 Corp (HUT) stock is trading at $123.89 after a 6.51% gain on the day, with price action reflecting a strong move up and closing near the session high. The stock is currently positioned above its key moving averages, signaling near-term momentum remains positive.
Highlights
- HUT/USD maintains a bullish trend, currently trading comfortably above key short- and long-term moving averages.
- Multiple technical indicators signal overbought conditions, raising the probability of a near-term pullback despite persistent upward pressure.
- Price is expected to consolidate within the $114.62–$133.16 range over the next 2–3 days, with a 79% likelihood of an upside move.
Overbought signals and bullish bias as support holds above moving averages
On the hourly chart, HUT is holding above the MA-20 ($112.14) and MA-50 ($117.56), while on the daily timeframe, the price remains well above the MA-200 ($57.43). Immediate support is defined by the Ichimoku Kijun at $114.53. Momentum readings present a mixed technical landscape: MACD and ADX are both neutral, while RSI is moderately elevated at 63.38. Both Stoch RSI and CCI indicate overbought conditions, as does the BBP indicator, highlighting stretched buying pressure intraday. The Awesome Oscillator supports ongoing bullish interest, though the cluster of overbought signals flags elevated risk of a corrective pullback.
Upside favored as wide band sets stage for breakout or pullback
In the short term, the expected price band spans $114.62–$133.16, reflecting a volatility band relative to current levels. The probability skew favors continued upside movement (79%) against a 21% chance of a near-term downside move. The baseline scenario calls for consolidation within this range. A bullish breakout above $133.16 would open the way for further gains, while a breakdown below immediate support at $114.53 could invite a deeper retracement.
Earlier, analysts noted that Hut 8 was demonstrating sustained bullish momentum supported by robust technical trends. The current setup strengthens that outlook, but stretched overbought signals underline the importance of monitoring for a potential corrective pullback if the price fails to break and hold above $133.16.


Latest Hut 8 News


-
 Afghanistan
-
 Albania
-
 Algeria
-
 Angola
-
 Argentina
-
 Armenia
-
 Australia
-
 Austria
-
 Azerbaijan
-
 Bahamas
-
 Bahrain
-
 Bangladesh
-
 Belarus
-
 Belgium
-
 Bolivia
-
 Botswana
-
 Brazil
-
 Brunei
-
 Bulgaria
-
 Cambodia
-
 Cameroon
-
 Canada
-
 Chile
Chile
-
 China
China
-
 Colombia
-
 Congo
Congo
-
 Costa Rica
-
 Cote d'Ivoire
-
 Croatia
-
 Cuba
Cuba
-
 Cyprus
-
 Czechia
-
 DR Congo
-
 Denmark
-
 Dominican Republic
-
 Ecuador
-
 Egypt
Egypt
-
 El Salvador
-
 Estonia
-
 Eswatini
-
 Ethiopia
-
 Finland
-
 France
-
 Georgia
-
 Germany
-
 Ghana
Ghana
-
 Greece
-
 Haiti
Haiti
-
 Hong Kong
-
 Hungary
-
 India
India
-
 Indonesia
-
 Iran, Islamic republic
-
 Iraq
Iraq
-
 Ireland
-
 Israel
-
 Italy
Italy
-
 Jamaica
-
 Japan
Japan
-
 Jordan
-
 Kazakhstan
-
 Kenya
Kenya
-
 Korea
Korea
-
 Kuwait
-
 Kyrgyzstan
-
 Laos
Laos
-
 Latvia
-
 Lebanon
-
 Lesotho
-
 Libya
Libya
-
 Lithuania
-
 Luxembourg
-
 Madagascar
-
 Malaysia
-
 Malta
Malta
-
 Mauritius
-
 Mexico
-
 Moldova
-
 Mongolia
-
 Montenegro
-
 Morocco
-
 Mozambique
-
 Myanmar
-
 Namibia
-
 Nepal
Nepal
-
 Netherlands
-
 New Zealand
-
 Nigeria
-
 North Macedonia
-
 Norway
-
 Oman
Oman
-
 Pakistan
-
 Palestine
-
 Panama
-
 Papua New Guinea
-
 Paraguay
-
 Peru
Peru
-
 Philippines
-
 Poland
-
 Portugal
-
 Puerto Rico
-
 Qatar
Qatar
-
 Reunion
-
 Romania
-
 Rwanda
-
 Saudi Arabia
-
 Serbia
-
 Singapore
-
 Slovakia
-
 Slovenia
-
 Somalia
-
 South Africa
-
 Spain
Spain
-
 Sri Lanka
-
 Sweden
-
 Switzerland
-
 Syria
Syria
-
 Taiwan
-
 Tajikistan
-
 Tanzania
-
 Thailand
-
 Trinidad and Tobago
-
 Tunisia
-
 Turkey
-
 UAE
UAE
-
 Uganda
-
 Ukraine
-
 United Kingdom
-
United States
-
 Uruguay
-
 Uzbekistan
-
 Venezuela
-
 Vietnam
-
 Yemen
Yemen
-
 Zambia
-
 Zimbabwe
- Forex
- Crypto
