
Robinhood stock falls as 47% plunge in cryptocurrency trading revenue weighs

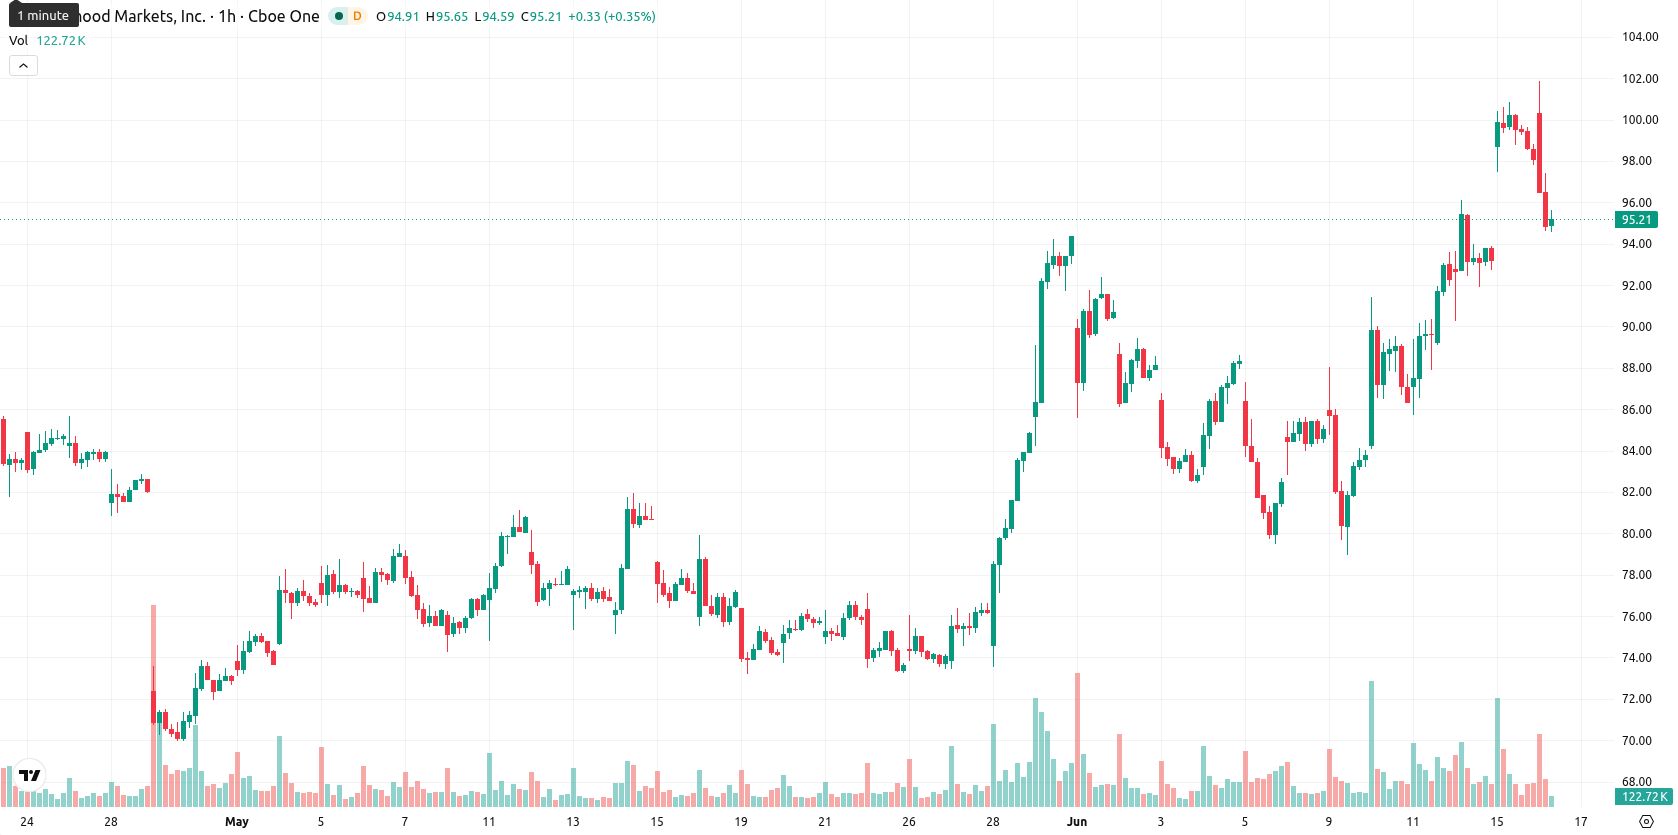
Robinhood Markets Inc (HOOD) stock is trading at $94.75, down 3.43% on the day and near its session low. The shares are currently below their key short- and long-term moving averages, reflecting continued downward momentum in the short term.
Highlights
- Robinhood is cutting 10% of its workforce, incurring $28 million in one-time charges to streamline operations.
- First quarter 2026 cryptocurrency trading revenue fell 47% year-over-year to $134 million, underscoring continued weakness in digital assets.
- Technicals indicate potential price consolidation between $87.24 and $102.26, with momentum signals bullish despite persistent intraday selling pressure.
Restructuring charges and crypto weakness drive persistent selling pressure
Robinhood announced a 10% reduction in its full-time workforce, impacting around 290 employees as part of a restructuring initiative aimed at streamlining operations and flattening management layers. According to the company's release, this process will result in about $20 million in one-time severance and benefits charges, alongside an $8 million share-based compensation expense, both to be booked in the second quarter of 2026. In addition, Robinhood reported a 47% year-over-year decrease in cryptocurrency trading revenue to $134 million in the first quarter of 2026, reflecting softer demand in the digital asset segment. The rollout of its AI-powered Agentic Trading platform for all users was also completed, potentially broadening engagement with the product offering, though price action has remained under broader selling pressure.
Mixed momentum signals amid price divergence and contested technical range
Technically, HOOD is positioned below its MA-20 and MA-200 averages, but remains above the MA-50, reflecting conflicting signals between short-term and medium-term supports. On the daily chart, immediate support is identified at the Ichimoku Kijun level of $93.51. Key resistance stands at $102.26, with support at $87.24. Momentum indicators are mixed: the MACD remains firmly in buy territory, the ADX confirms an ongoing uptrend, and the RSI shows a buying signal. However, Stoch RSI is oversold, CCI is neutral, and BBP readings point to seller dominance intraday. The Awesome Oscillator offers no clear directional signal, while divergence persists between the momentum signals and the weak intraday price action.
Consolidation favored as breakout and support risks shape outlook
In the coming sessions, HOOD is expected to trade within a typical volatility band of $87.24 to $102.26. A consolidation scenario is most probable, with 67% odds for an upward move and 33% chance of a further decline. A bullish breakout above $102.26 could accelerate gains toward the upper end of the short-term range, while a downside scenario would see the price drop below immediate support at $93.51 and head toward $87.24.
Previously it was reported that Robinhood began a significant workforce reduction aimed at streamlining operations and mitigating recent pressures in its crypto trading segment. With technical indicators now sending mixed signals and intraday price weakness continuing, traders should closely monitor $93.51 as a critical level that could determine the next directional move for HOOD shares.


Latest Robinhood News


-
 Afghanistan
-
 Albania
-
 Algeria
-
 Angola
-
 Argentina
-
 Armenia
-
 Australia
-
 Austria
-
 Azerbaijan
-
 Bahamas
-
 Bahrain
-
 Bangladesh
-
 Belarus
-
 Belgium
-
 Bolivia
-
 Botswana
-
 Brazil
-
 Brunei
-
 Bulgaria
-
 Cambodia
-
 Cameroon
-
 Canada
-
 Chile
Chile
-
 China
China
-
 Colombia
-
 Congo
Congo
-
 Costa Rica
-
 Cote d'Ivoire
-
 Croatia
-
 Cuba
Cuba
-
 Cyprus
-
 Czechia
-
 DR Congo
-
 Denmark
-
 Dominican Republic
-
 Ecuador
-
 Egypt
Egypt
-
 El Salvador
-
 Estonia
-
 Eswatini
-
 Ethiopia
-
 Finland
-
 France
-
 Georgia
-
 Germany
-
 Ghana
Ghana
-
 Greece
-
 Haiti
Haiti
-
 Hong Kong
-
 Hungary
-
 India
India
-
 Indonesia
-
 Iran, Islamic republic
-
 Iraq
Iraq
-
 Ireland
-
 Israel
-
 Italy
Italy
-
 Jamaica
-
 Japan
Japan
-
 Jordan
-
 Kazakhstan
-
 Kenya
Kenya
-
 Korea
Korea
-
 Kuwait
-
 Kyrgyzstan
-
 Laos
Laos
-
 Latvia
-
 Lebanon
-
 Lesotho
-
 Libya
Libya
-
 Lithuania
-
 Luxembourg
-
 Madagascar
-
 Malaysia
-
 Malta
Malta
-
 Mauritius
-
 Mexico
-
 Moldova
-
 Mongolia
-
 Montenegro
-
 Morocco
-
 Mozambique
-
 Myanmar
-
 Namibia
-
 Nepal
Nepal
-
 Netherlands
-
 New Zealand
-
 Nigeria
-
 North Macedonia
-
 Norway
-
 Oman
Oman
-
 Pakistan
-
 Palestine
-
 Panama
-
 Papua New Guinea
-
 Paraguay
-
 Peru
Peru
-
 Philippines
-
 Poland
-
 Portugal
-
 Puerto Rico
-
 Qatar
Qatar
-
 Reunion
-
 Romania
-
 Rwanda
-
 Saudi Arabia
-
 Serbia
-
 Singapore
-
 Slovakia
-
 Slovenia
-
 Somalia
-
 South Africa
-
 Spain
Spain
-
 Sri Lanka
-
 Sweden
-
 Switzerland
-
 Syria
Syria
-
 Taiwan
-
 Tajikistan
-
 Tanzania
-
 Thailand
-
 Trinidad and Tobago
-
 Tunisia
-
 Turkey
-
 UAE
UAE
-
 Uganda
-
 Ukraine
-
 United Kingdom
-
United States
-
 Uruguay
-
 Uzbekistan
-
 Venezuela
-
 Vietnam
-
 Yemen
Yemen
-
 Zambia
-
 Zimbabwe
- Forex
- Crypto
