
Broadcom stock drops as persistent short-term selling pressures price toward $368.66 level

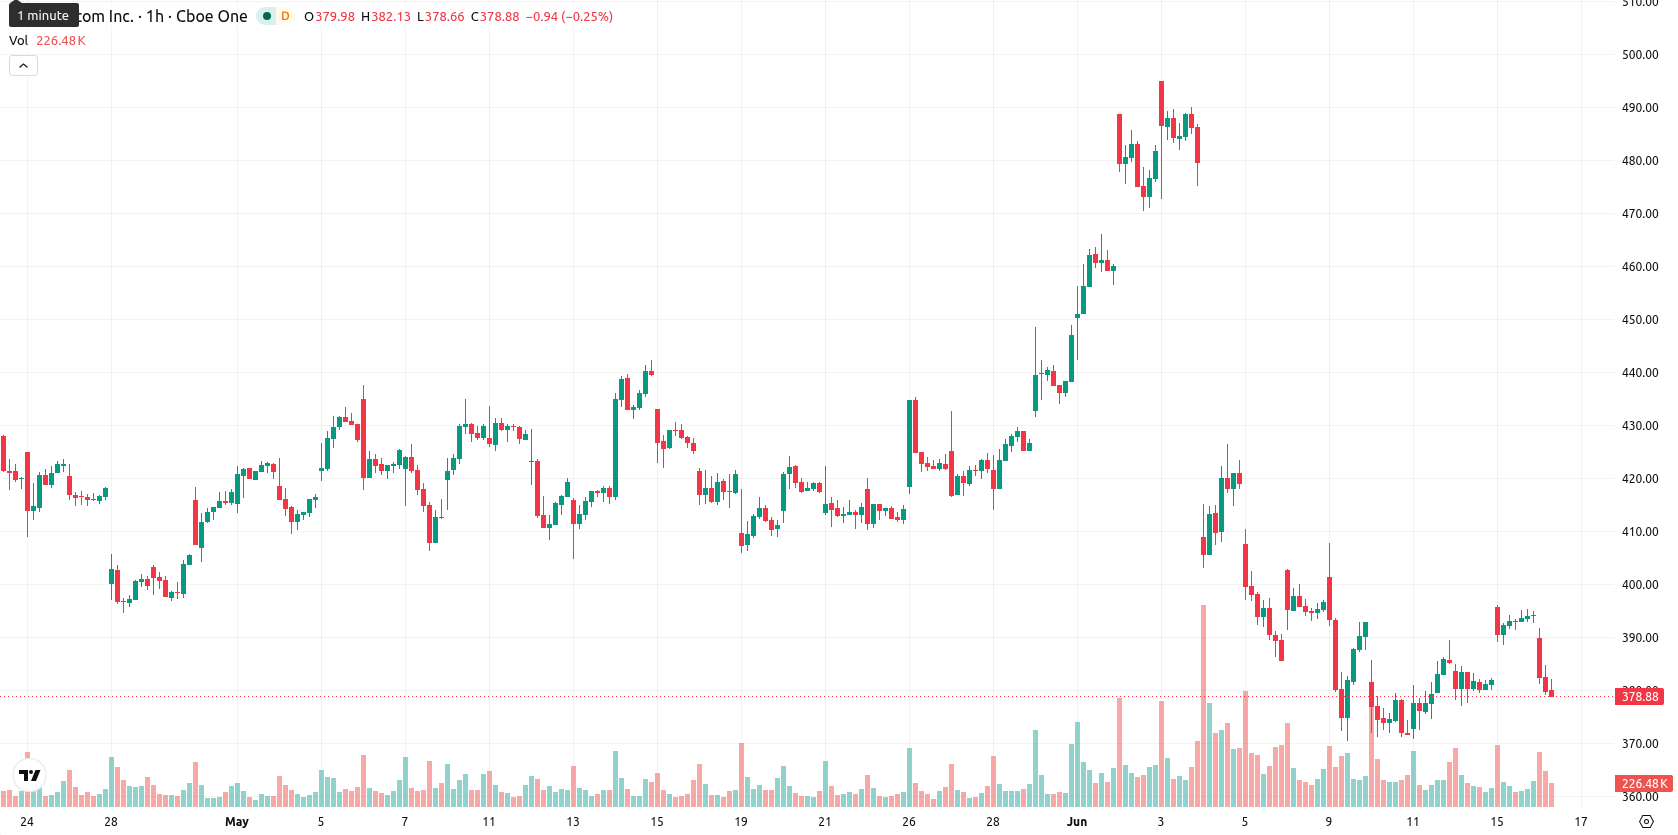
Apple Inc. (AVGO) stock is trading at $379.66 after falling 3.54% today. The price sits below its key short- and medium-term moving averages, while remaining above the long-term average.
Highlights
- Broadcom posted record quarterly results with $22.19 billion revenue and $9.31 billion net income, propelled by strong AI and data center demand.
- The company secured major long-term chip supply agreements, including a partnership with Alphabet through 2031, providing multi-year business visibility.
- AVGO trades under short- and medium-term moving averages with a bearish intraday bias, facing likely consolidation between $368.66 and $390.66.
Record quarter and AI demand boost outlook amid persistent selling
Broadcom recorded a record fiscal second quarter, reporting revenue of US$22.19 billion and net income of US$9.31 billion, evidence of strong operational performance driven by sustained AI and data center demand. The company launched its new AI XPV Platform through partnerships with Apollo and Blackstone, and secured substantial funding for large-scale infrastructure projects, accompanied by new agreements with AI innovators such as Anthropic and OpenAI. Recent insider activity was reflected in director Harry You’s purchase of 1,000 shares for nearly $374,000 on June 11, 2026, while Broadcom also moved to further strengthen its balance sheet via cash tender offers and fixed-income exchange initiatives. The company’s long-term chip supply agreements, including those through 2031 with Alphabet, further anchor its business outlook, though price action has remained under broader selling pressure.
Intraday divergence as oscillators contrast resistance and support levels
AVGO is currently below its MA-20 and MA-50 on the hourly chart, with key resistance defined by the Ichimoku Kijun at $383.38 and support at the long-term MA-200. Intraday oscillators show a divergence: the MACD is giving a strong buy signal while RSI indicates a sell bias, Stoch RSI and BBP are both in oversold territory, and the ADX and CCI register neutral readings. The opening gap down and moderate volatility reflect short-term seller dominance despite mixed momentum indicators.
Downside favored as volatility band contains near-term moves
In the short term, AVGO is likely to consolidate between $368.66 and $390.66, representing a volatility band relative to current levels. The probability model favors further downside with a 76% likelihood of a downward move versus 24% for an upward reversal. If the price breaks above $383.38, this could trigger a bullish scenario, while a move below $368.66 would signal additional weakness and an extension of recent declines.
Previously it was reported that Broadcom maintained a bullish structure supported by strong earnings and leadership in AI infrastructure, though rising overbought risks called for caution. The current environment marks a shift toward short-term downside pressure, making the $368.66 support and $383.38 resistance key levels for traders to monitor as consolidation unfolds.


-
 Afghanistan
-
 Albania
-
 Algeria
-
 Angola
-
 Argentina
-
 Armenia
-
 Australia
-
 Austria
-
 Azerbaijan
-
 Bahamas
-
 Bahrain
-
 Bangladesh
-
 Belarus
-
 Belgium
-
 Bolivia
-
 Botswana
-
 Brazil
-
 Brunei
-
 Bulgaria
-
 Cambodia
-
 Cameroon
-
 Canada
-
 Chile
Chile
-
 China
China
-
 Colombia
-
 Congo
Congo
-
 Costa Rica
-
 Cote d'Ivoire
-
 Croatia
-
 Cuba
Cuba
-
 Cyprus
-
 Czechia
-
 DR Congo
-
 Denmark
-
 Dominican Republic
-
 Ecuador
-
 Egypt
Egypt
-
 El Salvador
-
 Estonia
-
 Eswatini
-
 Ethiopia
-
 Finland
-
 France
-
 Georgia
-
 Germany
-
 Ghana
Ghana
-
 Greece
-
 Haiti
Haiti
-
 Hong Kong
-
 Hungary
-
 India
India
-
 Indonesia
-
 Iran, Islamic republic
-
 Iraq
Iraq
-
 Ireland
-
 Israel
-
 Italy
Italy
-
 Jamaica
-
 Japan
Japan
-
 Jordan
-
 Kazakhstan
-
 Kenya
Kenya
-
 Korea
Korea
-
 Kuwait
-
 Kyrgyzstan
-
 Laos
Laos
-
 Latvia
-
 Lebanon
-
 Lesotho
-
 Libya
Libya
-
 Lithuania
-
 Luxembourg
-
 Madagascar
-
 Malaysia
-
 Malta
Malta
-
 Mauritius
-
 Mexico
-
 Moldova
-
 Mongolia
-
 Montenegro
-
 Morocco
-
 Mozambique
-
 Myanmar
-
 Namibia
-
 Nepal
Nepal
-
 Netherlands
-
 New Zealand
-
 Nigeria
-
 North Macedonia
-
 Norway
-
 Oman
Oman
-
 Pakistan
-
 Palestine
-
 Panama
-
 Papua New Guinea
-
 Paraguay
-
 Peru
Peru
-
 Philippines
-
 Poland
-
 Portugal
-
 Puerto Rico
-
 Qatar
Qatar
-
 Reunion
-
 Romania
-
 Rwanda
-
 Saudi Arabia
-
 Serbia
-
 Singapore
-
 Slovakia
-
 Slovenia
-
 Somalia
-
 South Africa
-
 Spain
Spain
-
 Sri Lanka
-
 Sweden
-
 Switzerland
-
 Syria
Syria
-
 Taiwan
-
 Tajikistan
-
 Tanzania
-
 Thailand
-
 Trinidad and Tobago
-
 Tunisia
-
 Turkey
-
 UAE
UAE
-
 Uganda
-
 Ukraine
-
 United Kingdom
-
United States
-
 Uruguay
-
 Uzbekistan
-
 Venezuela
-
 Vietnam
-
 Yemen
Yemen
-
 Zambia
-
 Zimbabwe
- Forex
- Crypto
