
+3.14% for Interactive Brokers stock as Morgan Stanley financials conference presentation lifts sentiment

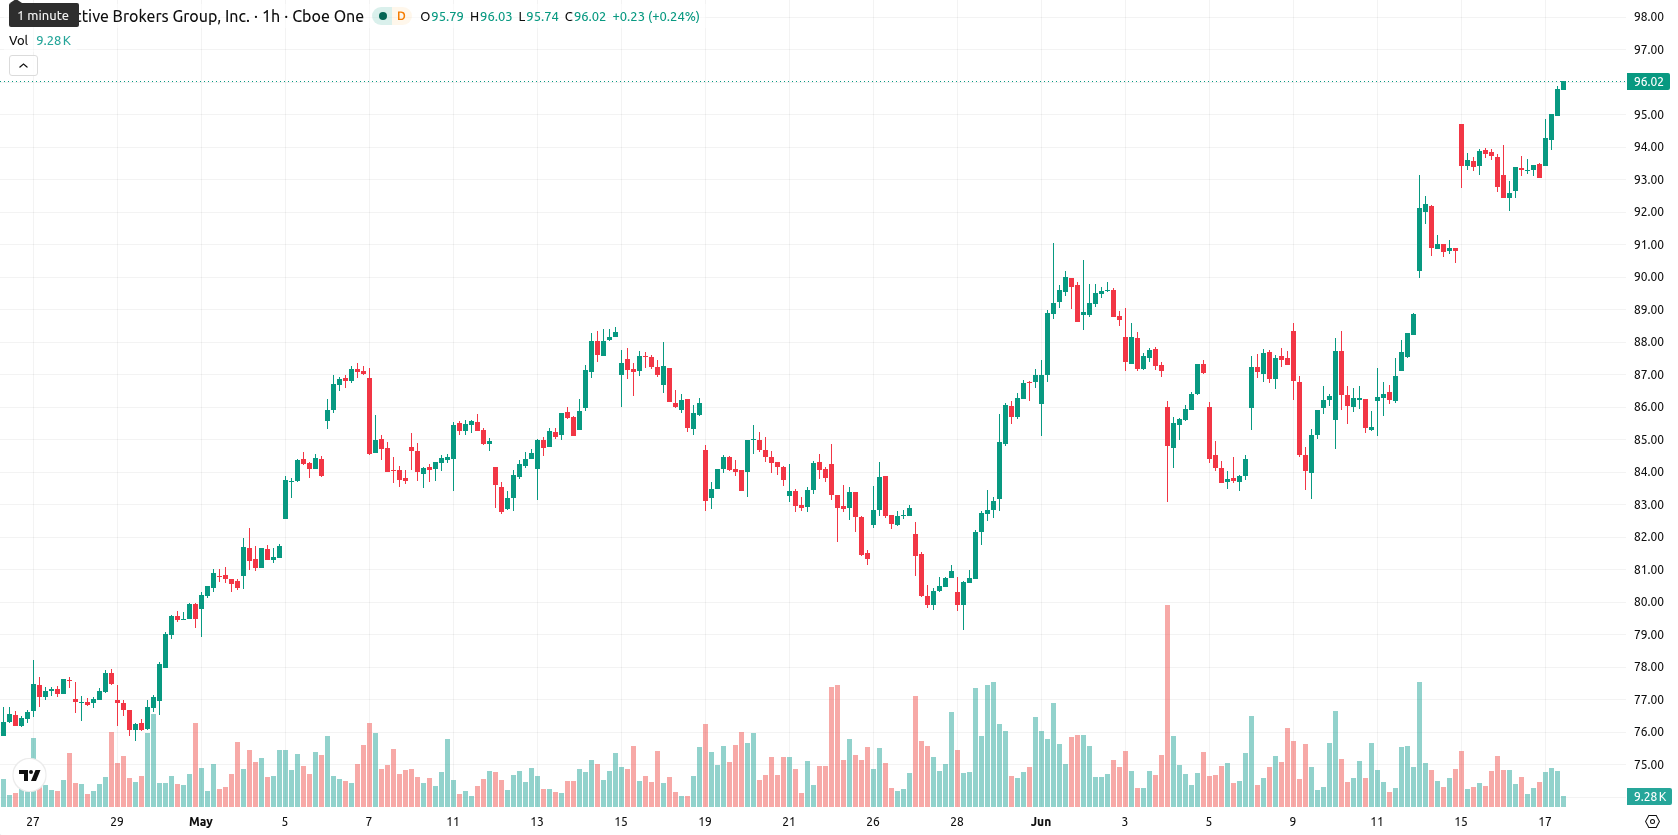
Interactive Brokers Group, Inc. (IBKR) stock is trading at $96.02, posting a daily gain of 3.14%. The price sits well above its key moving averages, indicating strong recent upward momentum versus typical short- and long-term benchmarks.
Highlights
- Interactive Brokers’ management engaged institutional investors at the Morgan Stanley US Financials Conference, improving transparency and direct communication of strategic priorities.
- The conference appearance increased company visibility, supporting ongoing institutional interest and providing potential support for IBKR share demand.
- IBKR demonstrates bullish momentum across timeframes, trading above support with a projected short-term range of $91.70 to $100.34, but overbought signals indicate caution for late buyers.
Institutional engagement increases after corporate presentation in New York
Interactive Brokers Group, Inc. presented at the Morgan Stanley US Financials Conference in New York on June 9, 2026, providing institutional investors an opportunity to engage directly with management and hear detailed updates on the company’s current positioning. This in-person outreach improves transparency and allows the firm to communicate strategic priorities, which can attract greater interest from large market participants. The event heightens visibility among institutional investors, a factor that can support sustained demand for IBKR shares in the current market context.
Overbought signals emerge as bullish momentum persists above key supports
The hourly chart shows IBKR trading above MA-20 at $93.44 and MA-50 at $89.78, while the daily chart places it well beyond MA-200 at $71.87. Key support is found at the Ichimoku Kijun level of $92.04. Momentum readings remain strong: MACD and ADX both flag active buy conditions, while the Awesome Oscillator is distinctly positive. However, RSI at 74.94, alongside elevated Stoch RSI, CCI, and BBP values, all signal an overbought environment and suggest any additional gains may trigger short-term corrections.
Bullish breakout likely as volatility band defines short-term risk
In the near term, IBKR is expected to fluctuate between $91.70 and $100.34, marking a volatility band relative to current trading levels. With up-move probability estimated at 79%, bullish momentum is favored, and a breakout above resistance could accelerate gains. Conversely, a decisive drop below immediate support may prompt corrective pressure toward the lower end of the stated range.
Earlier, analysts noted that Interactive Brokers was exhibiting strong and sustained bullish momentum, underpinned by positive trends across key technical indicators and ongoing technology-driven initiatives. The latest developments—highlighted by robust price action, continued institutional engagement, and fresh momentum readings—reinforce the bullish outlook, with traders advised to monitor for a volatility-driven move beyond established range boundaries as a potential catalyst for the next directional trend.


Latest Interactive Brokers News


-
 Afghanistan
-
 Albania
-
 Algeria
-
 Angola
-
 Argentina
-
 Armenia
-
 Australia
-
 Austria
-
 Azerbaijan
-
 Bahamas
-
 Bahrain
-
 Bangladesh
-
 Belarus
-
 Belgium
-
 Bolivia
-
 Botswana
-
 Brazil
-
 Brunei
-
 Bulgaria
-
 Cambodia
-
 Cameroon
-
 Canada
-
 Chile
Chile
-
 China
China
-
 Colombia
-
 Congo
Congo
-
 Costa Rica
-
 Cote d'Ivoire
-
 Croatia
-
 Cuba
Cuba
-
 Cyprus
-
 Czechia
-
 DR Congo
-
 Denmark
-
 Dominican Republic
-
 Ecuador
-
 Egypt
Egypt
-
 El Salvador
-
 Estonia
-
 Eswatini
-
 Ethiopia
-
 Finland
-
 France
-
 Georgia
-
 Germany
-
 Ghana
Ghana
-
 Greece
-
 Haiti
Haiti
-
 Hong Kong
-
 Hungary
-
 India
India
-
 Indonesia
-
 Iran, Islamic republic
-
 Iraq
Iraq
-
 Ireland
-
 Israel
-
 Italy
Italy
-
 Jamaica
-
 Japan
Japan
-
 Jordan
-
 Kazakhstan
-
 Kenya
Kenya
-
 Korea
Korea
-
 Kuwait
-
 Kyrgyzstan
-
 Laos
Laos
-
 Latvia
-
 Lebanon
-
 Lesotho
-
 Libya
Libya
-
 Lithuania
-
 Luxembourg
-
 Madagascar
-
 Malaysia
-
 Malta
Malta
-
 Mauritius
-
 Mexico
-
 Moldova
-
 Mongolia
-
 Montenegro
-
 Morocco
-
 Mozambique
-
 Myanmar
-
 Namibia
-
 Nepal
Nepal
-
 Netherlands
-
 New Zealand
-
 Nigeria
-
 North Macedonia
-
 Norway
-
 Oman
Oman
-
 Pakistan
-
 Palestine
-
 Panama
-
 Papua New Guinea
-
 Paraguay
-
 Peru
Peru
-
 Philippines
-
 Poland
-
 Portugal
-
 Puerto Rico
-
 Qatar
Qatar
-
 Reunion
-
 Romania
-
 Rwanda
-
 Saudi Arabia
-
 Serbia
-
 Singapore
-
 Slovakia
-
 Slovenia
-
 Somalia
-
 South Africa
-
 Spain
Spain
-
 Sri Lanka
-
 Sweden
-
 Switzerland
-
 Syria
Syria
-
 Taiwan
-
 Tajikistan
-
 Tanzania
-
 Thailand
-
 Trinidad and Tobago
-
 Tunisia
-
 Turkey
-
 UAE
UAE
-
 Uganda
-
 Ukraine
-
 United Kingdom
-
United States
-
 Uruguay
-
 Uzbekistan
-
 Venezuela
-
 Vietnam
-
 Yemen
Yemen
-
 Zambia
-
 Zimbabwe
- Forex
- Crypto
