
-5.09% for AMD stock as caution grows after rapid session loss

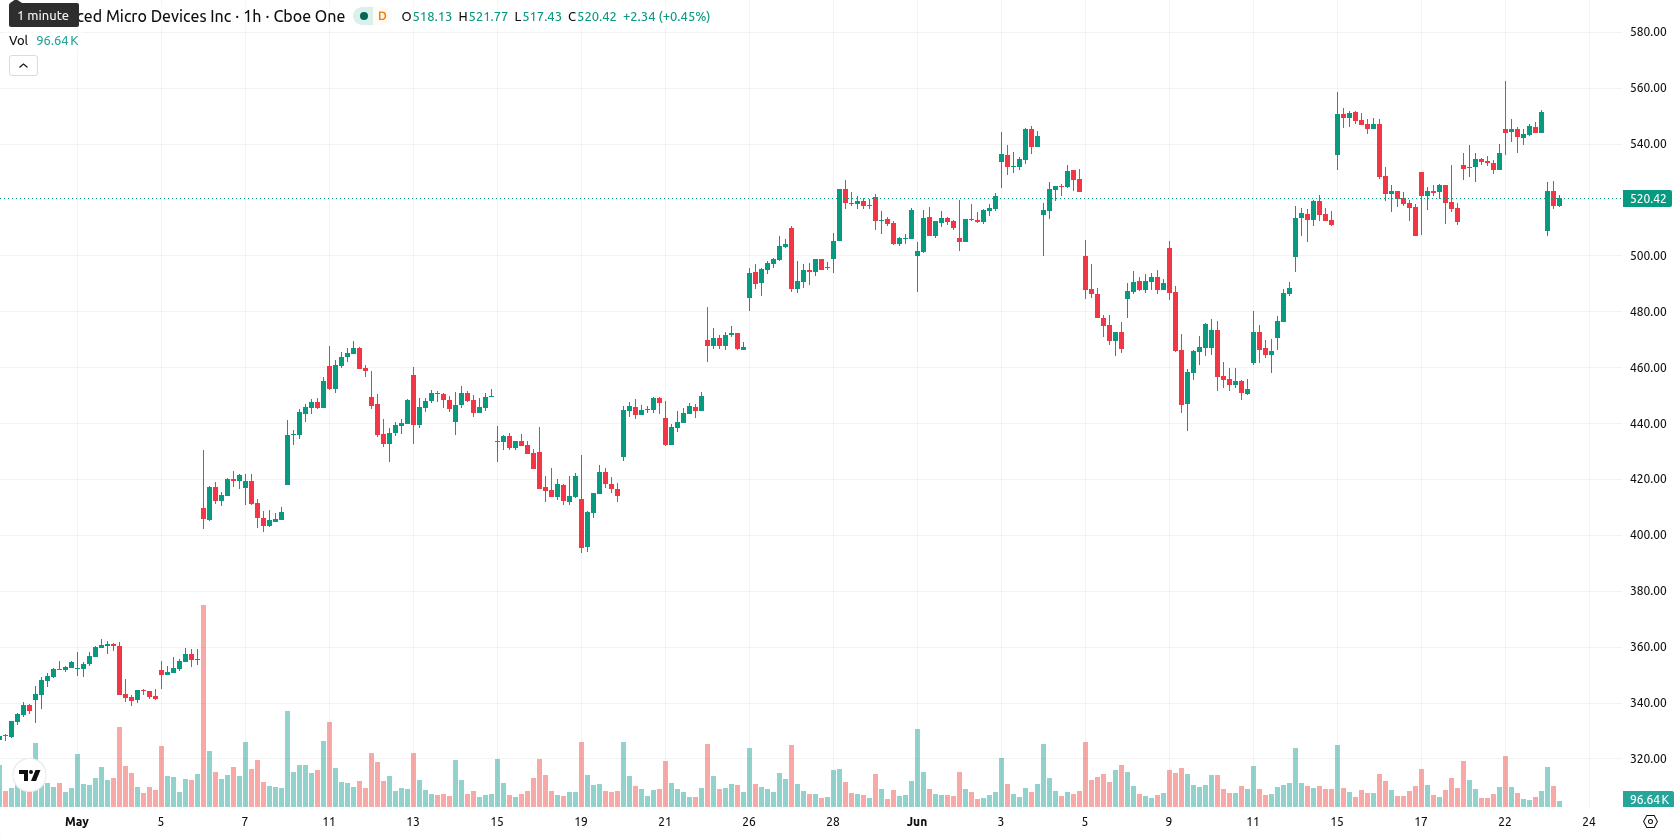
Apple Inc. (AMD) stock is trading at $522.90, down 5.09% for the session. The price currently sits below its key short- and medium-term moving averages, while remaining well above long-term trend levels.
Highlights
- AMD faces short- and medium-term downward pressure as it trades below key moving averages on the hourly chart.
- Bullish momentum indicators conflict with overbought signals, indicating strong buyer dominance but elevated risk of a near-term pullback.
- The price is expected to remain between $502.17 and $552.57, with high probability of consolidation and low risk of downside reversal.
Bullish momentum diverges from overbought indicators as caution rises
On the hourly chart, AMD has crossed below the MA-20 at $533.4 and the MA-50 at $523.12, while the daily MA-200 at $263.07 remains well below current levels. The Ichimoku Kijun level at $534.47 presents immediate resistance. Momentum indicators show mixed signals: the MACD and ADX both indicate bullish momentum, and RSI is elevated at 67.06, suggesting a buy setup. However, the Stoch RSI, CCI, and Bull/Bear Power are all in overbought territory, reflecting strong buyer dominance but highlighting risk of short-term exhaustion. The Awesome Oscillator is neutral. A wide gap of 30.92 is observed versus the prior close, with price sitting in the session's mid-range amid moderate volatility. This combination of bullish momentum and overbought oscillators demonstrates a divergence and flags caution for potential pullback.
Steady gains likely as volatility band limits downside risk
Over the short term, AMD is expected to trade within a range of $502.17 to $552.57, a volatility band relative to current levels. The probability of continued upside is classified as very high, with minimal risk of a downside reversal. In the baseline scenario, price remains steady within this range. A breach above resistance could trigger a bullish breakout, while a breakdown below support would indicate a bearish shift.
Earlier, analysts noted that AMD's high volatility and sensitivity to sector sentiment make it vulnerable to rapid swings on profit-taking or changes in AI market outlook. The current technical setup, with mixed momentum and overbought signals, elevates the importance of monitoring for a possible short-term pullback or breakout beyond the $502.17–$552.57 range.


-
 Afghanistan
-
 Albania
-
 Algeria
-
 Angola
-
 Argentina
-
 Armenia
-
 Australia
-
 Austria
-
 Azerbaijan
-
 Bahamas
-
 Bahrain
-
 Bangladesh
-
 Belarus
-
 Belgium
-
 Bolivia
-
 Botswana
-
 Brazil
-
 Brunei
-
 Bulgaria
-
 Cambodia
-
 Cameroon
-
 Canada
-
 Chile
Chile
-
 China
China
-
 Colombia
-
 Congo
Congo
-
 Costa Rica
-
 Cote d'Ivoire
-
 Croatia
-
 Cuba
Cuba
-
 Cyprus
-
 Czechia
-
 DR Congo
-
 Denmark
-
 Dominican Republic
-
 Ecuador
-
 Egypt
Egypt
-
 El Salvador
-
 Estonia
-
 Eswatini
-
 Ethiopia
-
 Finland
-
 France
-
 Georgia
-
 Germany
-
 Ghana
Ghana
-
 Greece
-
 Haiti
Haiti
-
 Hong Kong
-
 Hungary
-
 India
India
-
 Indonesia
-
 Iran, Islamic republic
-
 Iraq
Iraq
-
 Ireland
-
 Israel
-
 Italy
Italy
-
 Jamaica
-
 Japan
Japan
-
 Jordan
-
 Kazakhstan
-
 Kenya
Kenya
-
 Korea
Korea
-
 Kuwait
-
 Kyrgyzstan
-
 Laos
Laos
-
 Latvia
-
 Lebanon
-
 Lesotho
-
 Libya
Libya
-
 Lithuania
-
 Luxembourg
-
 Madagascar
-
 Malaysia
-
 Malta
Malta
-
 Mauritius
-
 Mexico
-
 Moldova
-
 Mongolia
-
 Montenegro
-
 Morocco
-
 Mozambique
-
 Myanmar
-
 Namibia
-
 Nepal
Nepal
-
 Netherlands
-
 New Zealand
-
 Nigeria
-
 North Macedonia
-
 Norway
-
 Oman
Oman
-
 Pakistan
-
 Palestine
-
 Panama
-
 Papua New Guinea
-
 Paraguay
-
 Peru
Peru
-
 Philippines
-
 Poland
-
 Portugal
-
 Puerto Rico
-
 Qatar
Qatar
-
 Reunion
-
 Romania
-
 Rwanda
-
 Saudi Arabia
-
 Serbia
-
 Singapore
-
 Slovakia
-
 Slovenia
-
 Somalia
-
 South Africa
-
 Spain
Spain
-
 Sri Lanka
-
 Sweden
-
 Switzerland
-
 Syria
Syria
-
 Taiwan
-
 Tajikistan
-
 Tanzania
-
 Thailand
-
 Trinidad and Tobago
-
 Tunisia
-
 Turkey
-
 UAE
UAE
-
 Uganda
-
 Ukraine
-
 United Kingdom
-
United States
-
 Uruguay
-
 Uzbekistan
-
 Venezuela
-
 Vietnam
-
 Yemen
Yemen
-
 Zambia
-
 Zimbabwe
- Forex
- Crypto
