
AMD stock slips below $501.40 support after high-bandwidth memory technology delay

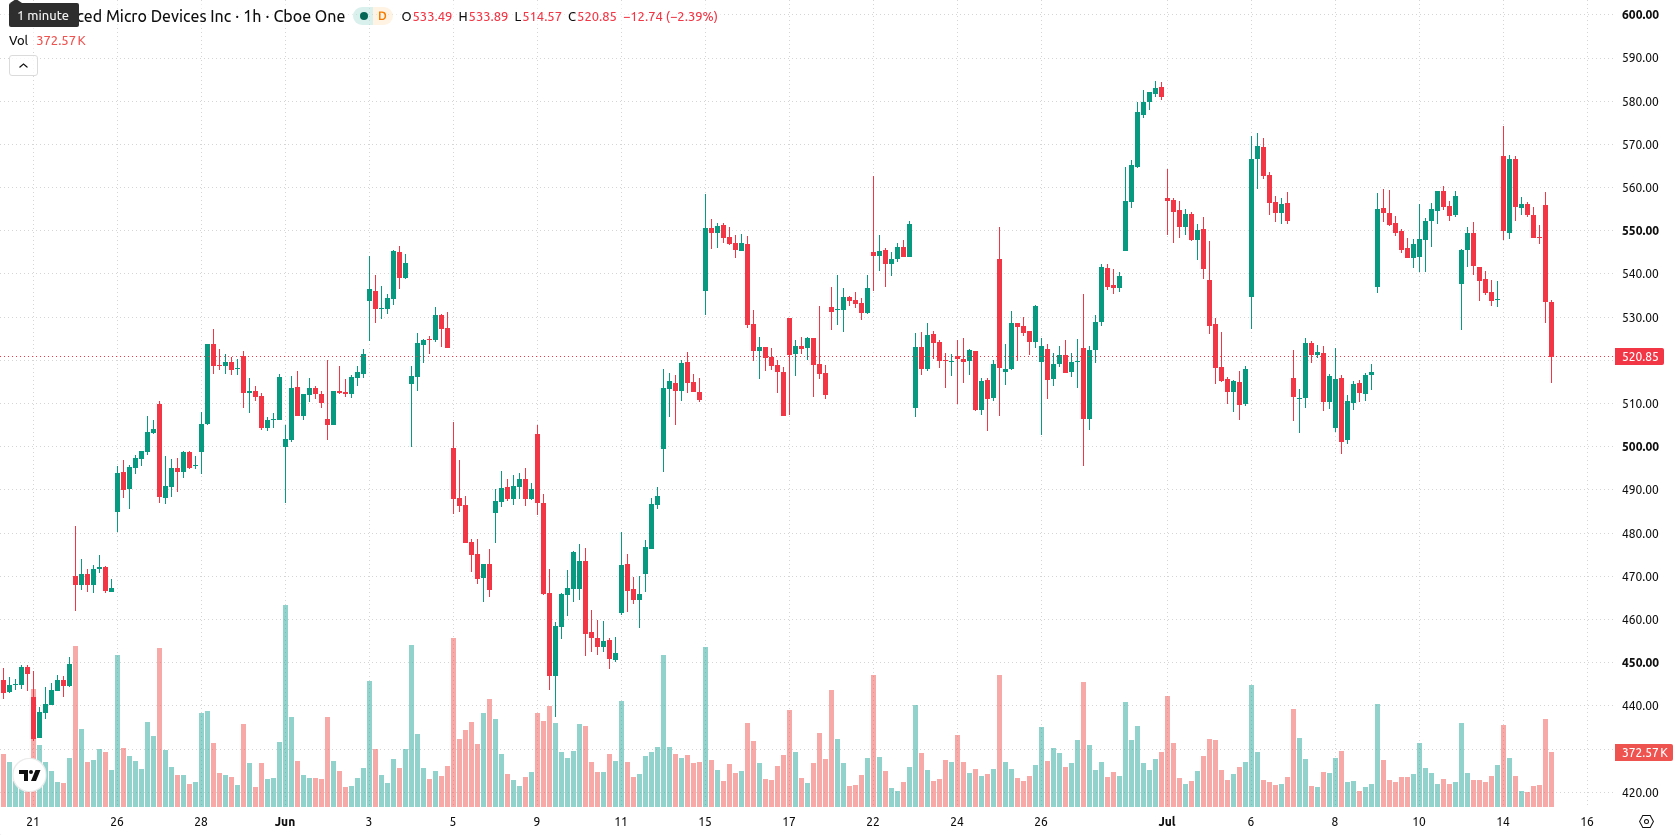
Advanced Micro Devices (AMD) stock is trading at $519.44, marking a decline of 5.08% on the day. The price sits below its key short- and medium-term moving averages, while remaining well above longer-term trend levels.
 538.81
567.26
538.81
567.26
Highlights
- AMD stock came under pressure as delays in high-bandwidth memory technology and Meta's cloud launch raised uncertainty about future AI-sector spending.
- Concerns over AI-driven demand have led to increased market caution and fresh doubts regarding near-term outlook for AMD products.
- Technical signals point to ongoing short-term bearish pressure, with expected price oscillation between $501.40 and $551.62 amid high volatility.
Spending doubts as memory delays and Meta cloud shift sentiment
Advanced Micro Devices has faced renewed selling after developments in the semiconductor space dampened investor sentiment. A reported delay in high-bandwidth memory technology, combined with Meta's cloud launch, has brought fresh questions about the tempo of spending in the artificial intelligence sector. The resulting uncertainty over future demand for AMD's products has contributed to caution in the market and a retreat in the stock.
Mixed momentum as price tests resistance amid split indicators
On the hourly chart, AMD is currently trading beneath both the 20-period moving average at $549.52 and the 50-period moving average at $541.21, while staying well above the 200-period moving average at $291.44 on the daily chart. Ichimoku Kijun indicates immediate resistance at $550.59. Today's session began with an 8.45-point gap lower and price action remains volatile, skirting the day’s low. Indicator readings are split: the Moving Average Convergence Divergence (MACD) signals strong buy momentum, while the Average Directional Index (ADX) is neutral, suggesting trend strength remains uncertain. The Relative Strength Index (RSI) stands at 50.66, indicating a modest upward bias, even as Bull/Bear Power highlights overbought conditions. Meanwhile, the Awesome Oscillator, Commodity Channel Index (CCI), and Stochastic RSI all show neutral stances.
Volatility band defines near-term outlook with break risks
Over the next two to three trading days, AMD is likely to oscillate between $501.4 and $551.62, reflecting a volatility band relative to current levels. The probability of an upward move stands at 56%, while the likelihood of a decline is 44%. Should AMD break above the $550.59 resistance, renewed upside momentum could quickly emerge; conversely, a move below $501.40 would signal intensifying selling pressure and open the door to further downside.
Earlier, analysts noted that AMD's technical picture was marked by uncertainty, with mixed momentum signals and a broadly sideways trading bias. The latest decline amid sector-specific headwinds introduces a shift toward heightened caution, making price reactions around the $550.59 resistance and $501.40 support pivotal for determining AMD’s near-term direction.









-
 Afghanistan
-
 Albania
-
 Algeria
-
 Angola
-
 Argentina
-
 Armenia
-
 Australia
-
 Austria
-
 Azerbaijan
-
 Bahamas
-
 Bahrain
-
 Bangladesh
-
 Belarus
-
 Belgium
-
 Bolivia
-
 Botswana
-
 Brazil
-
 Brunei
-
 Bulgaria
-
 Cambodia
-
 Cameroon
-
 Canada
-
 Chile
Chile
-
 China
China
-
 Colombia
-
 Congo
Congo
-
 Costa Rica
-
 Cote d'Ivoire
-
 Croatia
-
 Cuba
Cuba
-
 Cyprus
-
 Czechia
-
 DR Congo
-
 Denmark
-
 Dominican Republic
-
 Ecuador
-
 Egypt
Egypt
-
 El Salvador
-
 Estonia
-
 Eswatini
-
 Ethiopia
-
 Finland
-
 France
-
 Georgia
-
 Germany
-
 Ghana
Ghana
-
 Greece
-
 Haiti
Haiti
-
 Hong Kong
-
 Hungary
-
 India
India
-
 Indonesia
-
 Iran, Islamic republic
-
 Iraq
Iraq
-
 Ireland
-
 Israel
-
 Italy
Italy
-
 Jamaica
-
 Japan
Japan
-
 Jordan
-
 Kazakhstan
-
 Kenya
Kenya
-
 Korea
Korea
-
 Kuwait
-
 Kyrgyzstan
-
 Laos
Laos
-
 Latvia
-
 Lebanon
-
 Lesotho
-
 Libya
Libya
-
 Lithuania
-
 Luxembourg
-
 Madagascar
-
 Malaysia
-
 Malta
Malta
-
 Mauritius
-
 Mexico
-
 Moldova
-
 Mongolia
-
 Montenegro
-
 Morocco
-
 Mozambique
-
 Myanmar
-
 Namibia
-
 Nepal
Nepal
-
 Netherlands
-
 New Zealand
-
 Nigeria
-
 North Macedonia
-
 Norway
-
 Oman
Oman
-
 Pakistan
-
 Palestine
-
 Panama
-
 Papua New Guinea
-
 Paraguay
-
 Peru
Peru
-
 Philippines
-
 Poland
-
 Portugal
-
 Puerto Rico
-
 Qatar
Qatar
-
 Reunion
-
 Romania
-
 Rwanda
-
 Saudi Arabia
-
 Serbia
-
 Singapore
-
 Slovakia
-
 Slovenia
-
 Somalia
-
 South Africa
-
 Spain
Spain
-
 Sri Lanka
-
 Sweden
-
 Switzerland
-
 Syria
Syria
-
 Taiwan
-
 Tajikistan
-
 Tanzania
-
 Thailand
-
 Trinidad and Tobago
-
 Tunisia
-
 Turkey
-
 UAE
UAE
-
 Uganda
-
 Ukraine
-
 United Kingdom
-
United States
-
 Uruguay
-
 Uzbekistan
-
 Venezuela
-
 Vietnam
-
 Yemen
Yemen
-
 Zambia
-
 Zimbabwe
- Forex
- Crypto











