
Micron Technology stock trades lower as investors await clarity on fiscal Q3 results

Micron Technology (MU) stock is trading at $1,020, down 3.77% on the session. The price now sits below its key moving averages, reflecting notable short-term weakness.
Highlights
- Micron's fiscal Q3 earnings release introduces uncertainty, with investors closely watching for pivotal profitability and outlook signals.
- Market sentiment remains cautious ahead of results, as traders seek clarity on operational trends impacting Micron's forward guidance.
- Technical setup is decisively bearish intraday, with momentum indicators signaling oversold conditions and a 73% probability of downside toward $942.2.
Investor caution intensifies as earnings drive event risk
Micron Technology's upcoming fiscal third-quarter earnings, scheduled for release after Wednesday's market close, have placed the stock squarely in focus, according to Seekingalpha. The event introduces notable uncertainty for investors, as market participants await concrete operational results that will inform views on profitability and future outlook. Elevated anticipation surrounding the earnings report has contributed to a cautious tone in the market.
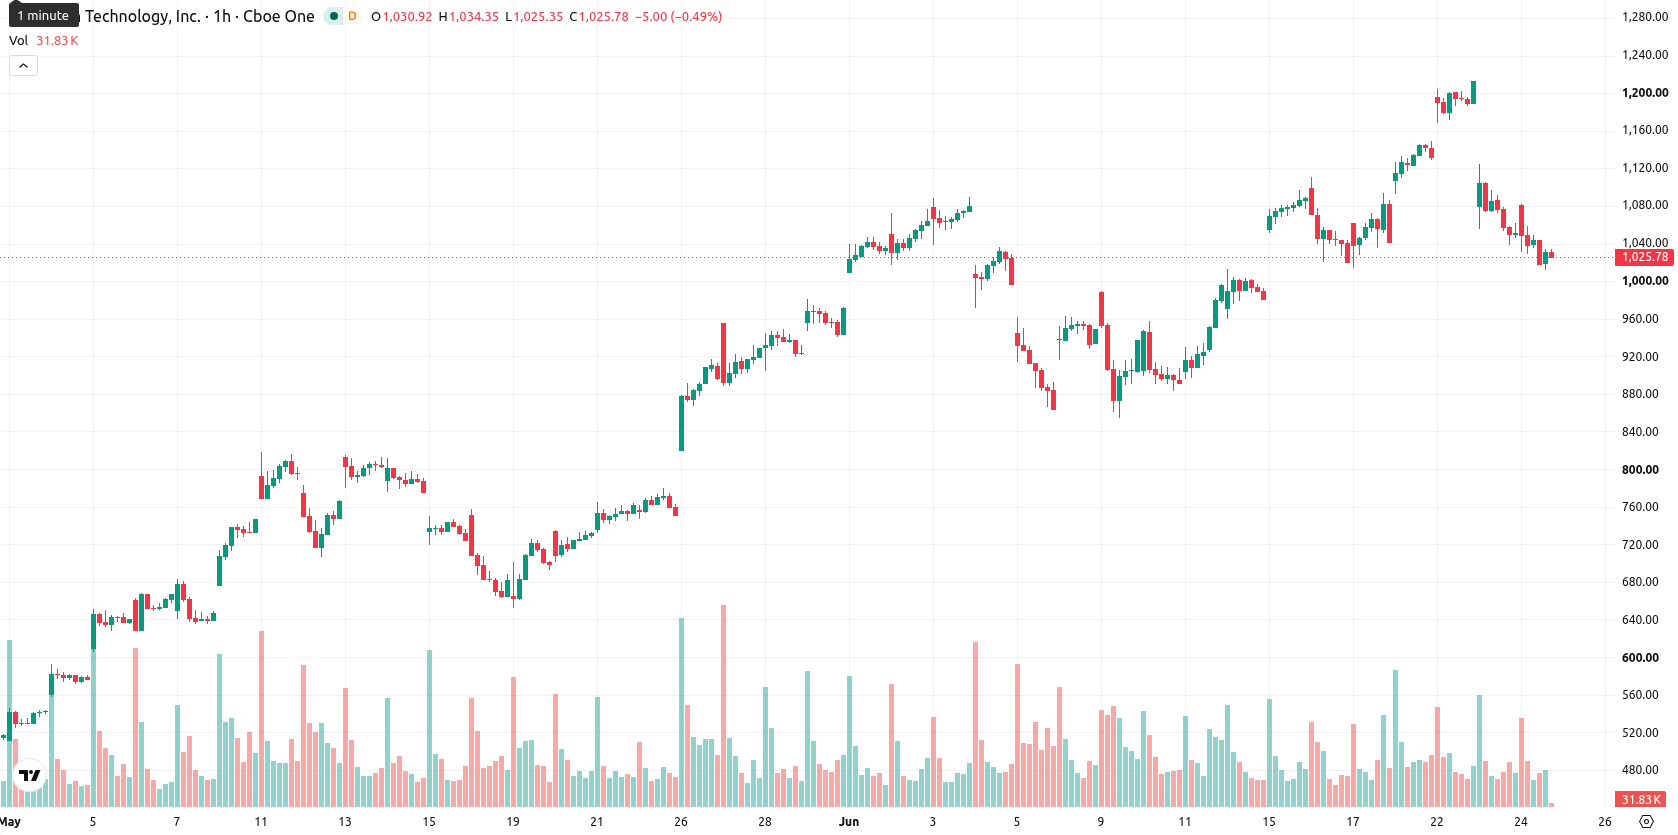
Downside momentum strengthens as technical indicators turn bearish
On the hourly chart, MU has moved below its 20-period and 50-period moving averages, with these set at $1,108 and $1,084, respectively. The daily chart shows price still well above the long-term 200-period moving average at $410. The Ichimoku Kijun on the daily timeframe stands as immediate resistance at $1,113. Momentum indicators confirm this negative setup: both the Moving Average Convergence Divergence (MACD) and Average Directional Index (ADX) point to downside strength. Relative Strength Index (RSI) sits at 34.31, and both the Commodity Channel Index (CCI) and Stochastic RSI reflect oversold conditions. Bull/Bear Power signals dominant selling, while the Awesome Oscillator supports the continued downtrend. Intraday volatility remains high, and price has held close to the session's low through persistent downside pressure.
Downside bias dominates as support and resistance define outlook
Over the next several sessions, MU is expected to trade within the $942 to $1,098 volatility band relative to current levels. Current probabilities suggest a 27% chance of an upward move versus 73% favoring further decline. The baseline scenario anticipates continued consolidation between support and resistance. A break above the Kijun resistance at $1,113 would open the door for a potential rebound, while a sustained move below $942 could accelerate further downside.
Earlier, analysts noted that Micron Technology was exhibiting mixed momentum as it navigated persistent volatility and AI-driven growth prospects. With short-term downside now evident ahead of its upcoming earnings report, investors should monitor for a potential shift in trend should the stock break decisively above the $1,113 resistance or fall below the $942 support zone.


Latest Micron Technology News


-
 Afghanistan
-
 Albania
-
 Algeria
-
 Angola
-
 Argentina
-
 Armenia
-
 Australia
-
 Austria
-
 Azerbaijan
-
 Bahamas
-
 Bahrain
-
 Bangladesh
-
 Belarus
-
 Belgium
-
 Bolivia
-
 Botswana
-
 Brazil
-
 Brunei
-
 Bulgaria
-
 Cambodia
-
 Cameroon
-
 Canada
-
 Chile
Chile
-
 China
China
-
 Colombia
-
 Congo
Congo
-
 Costa Rica
-
 Cote d'Ivoire
-
 Croatia
-
 Cuba
Cuba
-
 Cyprus
-
 Czechia
-
 DR Congo
-
 Denmark
-
 Dominican Republic
-
 Ecuador
-
 Egypt
Egypt
-
 El Salvador
-
 Estonia
-
 Eswatini
-
 Ethiopia
-
 Finland
-
 France
-
 Georgia
-
 Germany
-
 Ghana
Ghana
-
 Greece
-
 Haiti
Haiti
-
 Hong Kong
-
 Hungary
-
 India
India
-
 Indonesia
-
 Iran, Islamic republic
-
 Iraq
Iraq
-
 Ireland
-
 Israel
-
 Italy
Italy
-
 Jamaica
-
 Japan
Japan
-
 Jordan
-
 Kazakhstan
-
 Kenya
Kenya
-
 Korea
Korea
-
 Kuwait
-
 Kyrgyzstan
-
 Laos
Laos
-
 Latvia
-
 Lebanon
-
 Lesotho
-
 Libya
Libya
-
 Lithuania
-
 Luxembourg
-
 Madagascar
-
 Malaysia
-
 Malta
Malta
-
 Mauritius
-
 Mexico
-
 Moldova
-
 Mongolia
-
 Montenegro
-
 Morocco
-
 Mozambique
-
 Myanmar
-
 Namibia
-
 Nepal
Nepal
-
 Netherlands
-
 New Zealand
-
 Nigeria
-
 North Macedonia
-
 Norway
-
 Oman
Oman
-
 Pakistan
-
 Palestine
-
 Panama
-
 Papua New Guinea
-
 Paraguay
-
 Peru
Peru
-
 Philippines
-
 Poland
-
 Portugal
-
 Puerto Rico
-
 Qatar
Qatar
-
 Reunion
-
 Romania
-
 Rwanda
-
 Saudi Arabia
-
 Serbia
-
 Singapore
-
 Slovakia
-
 Slovenia
-
 Somalia
-
 South Africa
-
 Spain
Spain
-
 Sri Lanka
-
 Sweden
-
 Switzerland
-
 Syria
Syria
-
 Taiwan
-
 Tajikistan
-
 Tanzania
-
 Thailand
-
 Trinidad and Tobago
-
 Tunisia
-
 Turkey
-
 UAE
UAE
-
 Uganda
-
 Ukraine
-
 United Kingdom
-
United States
-
 Uruguay
-
 Uzbekistan
-
 Venezuela
-
 Vietnam
-
 Yemen
Yemen
-
 Zambia
-
 Zimbabwe
- Forex
- Crypto
