
Meta stock trades flat after AI development progress falls short of expectations

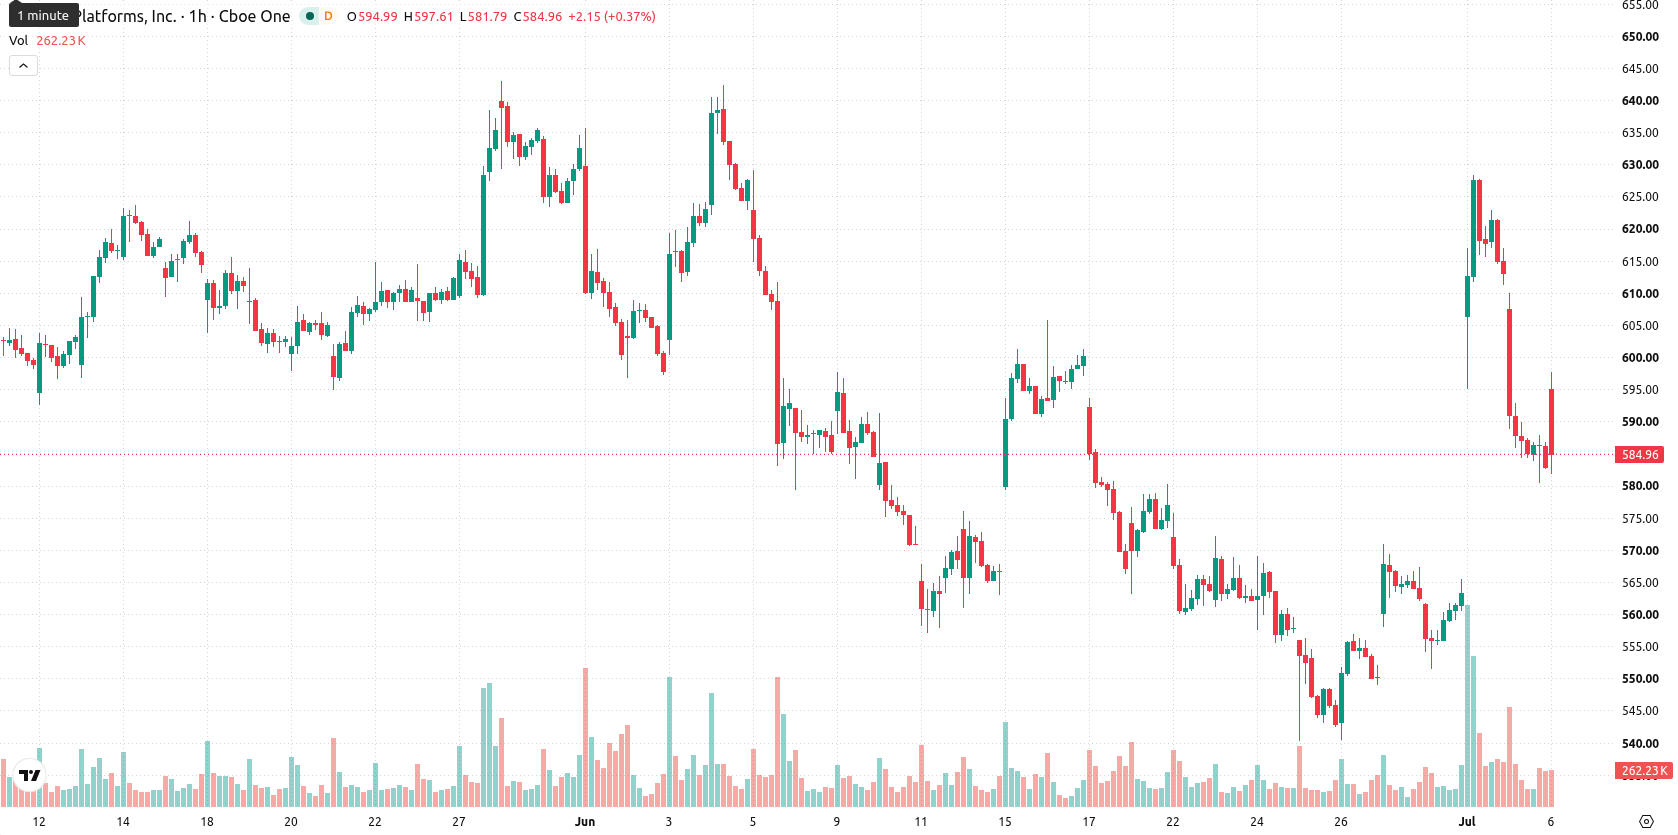
Meta (META) stock is trading at $585.26, marking a modest gain for the day. The price currently sits below its short-term averages but remains above medium-term trend levels, reflecting mixed directional signals.
 625.19
628.28
625.19
628.28
Highlights
- Meta plans to launch Meta Compute AI cloud services to monetize surplus computing and proprietary AI models, targeting higher-margin revenue streams.
- Despite the AI pivot, Meta faces headwinds from slower-than-expected AI development and post-layoff restructuring, increasing 2026 capital expenditure guidance to $125–$145 billion.
- Meta trades below key short-term averages with mixed momentum; price consolidates near $585.26, expected to range between $550.89 and $619.63 in the coming days.
Cloud AI launch and spending surge amid monetization, restructuring pressure
Meta Platforms is planning to launch its Meta Compute AI cloud business to monetize excess computing capacity and proprietary AI models, signaling a strategic move into high-margin cloud services and expanding its revenue base, according to Cryptobriefing. At the same time, Meta has acknowledged slower-than-expected progress in artificial intelligence development and noted challenges from its recent restructuring after eliminating 8,000 positions, according to Outlookbusiness. The company also raised its 2026 capital expenditure guidance to $125 billion–$145 billion, highlighting a substantial increase in planned investment for AI infrastructure following its April 29 earnings report.
Buyer and seller signals diverge as key resistance caps rebound
On the technical front, META trades below the MA-20 but holds above the MA-50 on the hourly chart, while staying well under the MA-200. Immediate resistance is established at the Ichimoku Kijun level of $589.86. Momentum indicators show a mixed landscape: the Moving Average Convergence Divergence (MACD) gives a strong buy signal and the Average Directional Index (ADX) leans toward the buy side, yet the Relative Strength Index (RSI) stands at 48.32 with a sell reading. The Stochastic RSI and Bull/Bear Power both flag oversold conditions, while the Commodity Channel Index (CCI) and Awesome Oscillator (AO) appear neutral. This divergence highlights short-term seller dominance despite some bullish momentum signals.
Sideways price scenario persists barring range breakout catalysts
Looking ahead, the typical volatility band for META over the next several days is projected at $550.89 to $619.63. A continuation of sideways consolidation is the baseline expectation. Should META break above the Kijun resistance, upside extension toward the upper bound of the range becomes likely. Conversely, a move below forecasted support could expose the lower end of the current trading corridor.
Earlier, analysts noted that Meta was benefiting from investor rotation into AI-driven cloud services, enhancing its long-term revenue prospects despite sector volatility. The current environment introduces heightened uncertainty due to elevated capital expenditures and mixed technical signals, making the Kijun resistance level at $589.86 a critical threshold for determining Meta’s near-term directional bias.





Latest META News









-
 Afghanistan
-
 Albania
-
 Algeria
-
 Angola
-
 Argentina
-
 Armenia
-
 Australia
-
 Austria
-
 Azerbaijan
-
 Bahamas
-
 Bahrain
-
 Bangladesh
-
 Belarus
-
 Belgium
-
 Bolivia
-
 Botswana
-
 Brazil
-
 Brunei
-
 Bulgaria
-
 Cambodia
-
 Cameroon
-
 Canada
-
 Chile
Chile
-
 China
China
-
 Colombia
-
 Congo
Congo
-
 Costa Rica
-
 Cote d'Ivoire
-
 Croatia
-
 Cuba
Cuba
-
 Cyprus
-
 Czechia
-
 DR Congo
-
 Denmark
-
 Dominican Republic
-
 Ecuador
-
 Egypt
Egypt
-
 El Salvador
-
 Estonia
-
 Eswatini
-
 Ethiopia
-
 Finland
-
 France
-
 Georgia
-
 Germany
-
 Ghana
Ghana
-
 Greece
-
 Haiti
Haiti
-
 Hong Kong
-
 Hungary
-
 India
India
-
 Indonesia
-
 Iran, Islamic republic
-
 Iraq
Iraq
-
 Ireland
-
 Israel
-
 Italy
Italy
-
 Jamaica
-
 Japan
Japan
-
 Jordan
-
 Kazakhstan
-
 Kenya
Kenya
-
 Korea
Korea
-
 Kuwait
-
 Kyrgyzstan
-
 Laos
Laos
-
 Latvia
-
 Lebanon
-
 Lesotho
-
 Libya
Libya
-
 Lithuania
-
 Luxembourg
-
 Madagascar
-
 Malaysia
-
 Malta
Malta
-
 Mauritius
-
 Mexico
-
 Moldova
-
 Mongolia
-
 Montenegro
-
 Morocco
-
 Mozambique
-
 Myanmar
-
 Namibia
-
 Nepal
Nepal
-
 Netherlands
-
 New Zealand
-
 Nigeria
-
 North Macedonia
-
 Norway
-
 Oman
Oman
-
 Pakistan
-
 Palestine
-
 Panama
-
 Papua New Guinea
-
 Paraguay
-
 Peru
Peru
-
 Philippines
-
 Poland
-
 Portugal
-
 Puerto Rico
-
 Qatar
Qatar
-
 Reunion
-
 Romania
-
 Rwanda
-
 Saudi Arabia
-
 Serbia
-
 Singapore
-
 Slovakia
-
 Slovenia
-
 Somalia
-
 South Africa
-
 Spain
Spain
-
 Sri Lanka
-
 Sweden
-
 Switzerland
-
 Syria
Syria
-
 Taiwan
-
 Tajikistan
-
 Tanzania
-
 Thailand
-
 Trinidad and Tobago
-
 Tunisia
-
 Turkey
-
 UAE
UAE
-
 Uganda
-
 Ukraine
-
 United Kingdom
-
United States
-
 Uruguay
-
 Uzbekistan
-
 Venezuela
-
 Vietnam
-
 Yemen
Yemen
-
 Zambia
-
 Zimbabwe
- Forex
- Crypto











