
What's behind Apple's latest 1.5% stock surge?

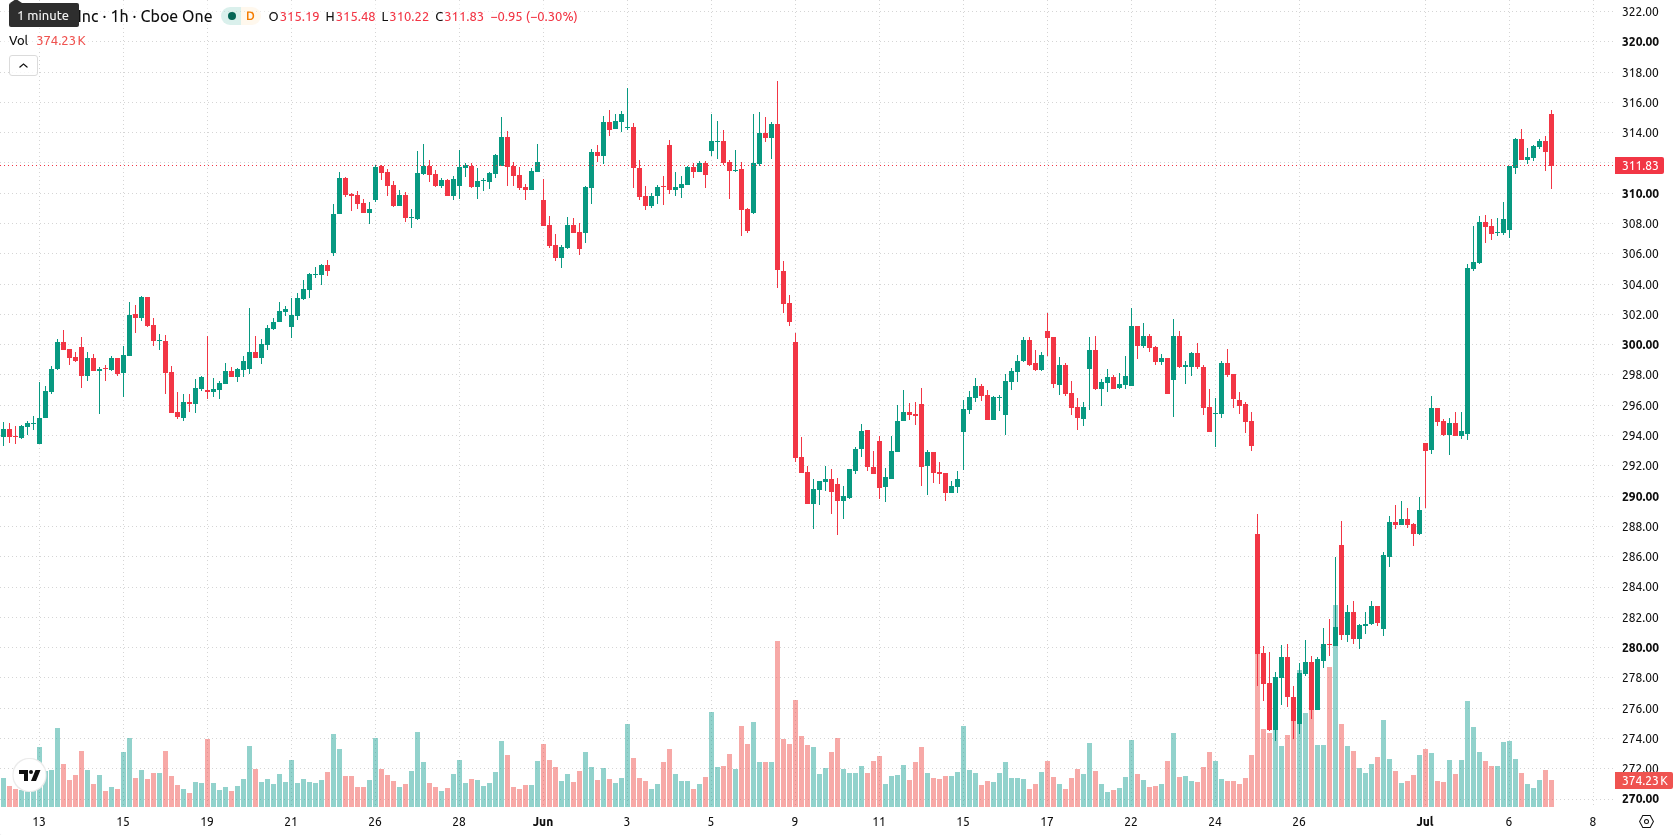
Apple (AAPL) stock is trading at $312.61, rising 1.46% on the day. The share price currently sits above its key moving averages, reflecting persistent buyer interest in both the short and long term.
 314.63
314.63
314.63
Highlights
- Apple secured an extended chip supply deal with Broadcom through 2031, ensuring long-term access to custom ASIC silicon.
- This agreement reduces supply chain risk and reinforces confidence in Apple's multi-year hardware product roadmap.
- AAPL confirms bullish momentum with strong buy signals and dominant buyer pressure, trading near the session high in a projected $297.64–$327.58 range.
Supply continuity bolsters sentiment as Apple secures Broadcom deal
Apple and Broadcom have extended their chip supply partnership through 2031, an agreement covering the development and delivery of custom ASIC silicon for multiple future generations of Apple devices, according to Bloomberg. This deal secures supply continuity for Apple's essential components, reducing risk of production bottlenecks and supporting confidence in the company’s long-term product pipeline. Stable access to advanced silicon is a crucial factor in maintaining Apple's competitive position and helps explain heightened buying interest seen today.
Bullish signals reign as mixed oscillators highlight overbought risk
On the technical front, AAPL is trading above the MA-20 at $305.31 and MA-50 at $291.26 on the hourly chart, and remains above the MA-200 at $271.05 on the daily timeframe. The Ichimoku Kijun provides immediate support at $300.44. Momentum signals are mixed: the Moving Average Convergence Divergence (MACD) indicates strong buying momentum, while the Average Directional Index (ADX) also points to bullishness. However, the Relative Strength Index (RSI) is elevated at 76.47, signaling overbought conditions, and although the Commodity Channel Index (CCI) remains in buy territory, the Stochastic RSI is oversold. The Bull/Bear Power indicator shows continued buyer dominance, whereas the Awesome Oscillator is neutral, reflecting some divergence among short-term oscillators.
Consolidation favored as volatility band tempers breakout prospects
Over the next 2-3 trading days, the anticipated price range for AAPL is $297.64 to $327.58, representing a typical volatility band relative to current levels. The most probable scenario—at a 78% likelihood—sees price action consolidating or trading sideways within this corridor. Should momentum persist, a bullish breakout above resistance could develop; a reversal would only emerge if support levels give way, which currently stands as a lower-probability outcome.
Earlier, analysts noted that investor confidence in Apple's long-term AI strategy and custom silicon investments remained a key driver for the stock’s positive outlook. The newly extended Broadcom partnership and continued momentum confirm the constructive thesis, with traders advised to monitor the $297.64–$327.58 corridor for signs of either sustained consolidation or a breakout in price action over the coming sessions.














-
 Afghanistan
-
 Albania
-
 Algeria
-
 Angola
-
 Argentina
-
 Armenia
-
 Australia
-
 Austria
-
 Azerbaijan
-
 Bahamas
-
 Bahrain
-
 Bangladesh
-
 Belarus
-
 Belgium
-
 Bolivia
-
 Botswana
-
 Brazil
-
 Brunei
-
 Bulgaria
-
 Cambodia
-
 Cameroon
-
 Canada
-
 Chile
Chile
-
 China
China
-
 Colombia
-
 Congo
Congo
-
 Costa Rica
-
 Cote d'Ivoire
-
 Croatia
-
 Cuba
Cuba
-
 Cyprus
-
 Czechia
-
 DR Congo
-
 Denmark
-
 Dominican Republic
-
 Ecuador
-
 Egypt
Egypt
-
 El Salvador
-
 Estonia
-
 Eswatini
-
 Ethiopia
-
 Finland
-
 France
-
 Georgia
-
 Germany
-
 Ghana
Ghana
-
 Greece
-
 Haiti
Haiti
-
 Hong Kong
-
 Hungary
-
 India
India
-
 Indonesia
-
 Iran, Islamic republic
-
 Iraq
Iraq
-
 Ireland
-
 Israel
-
 Italy
Italy
-
 Jamaica
-
 Japan
Japan
-
 Jordan
-
 Kazakhstan
-
 Kenya
Kenya
-
 Korea
Korea
-
 Kuwait
-
 Kyrgyzstan
-
 Laos
Laos
-
 Latvia
-
 Lebanon
-
 Lesotho
-
 Libya
Libya
-
 Lithuania
-
 Luxembourg
-
 Madagascar
-
 Malaysia
-
 Malta
Malta
-
 Mauritius
-
 Mexico
-
 Moldova
-
 Mongolia
-
 Montenegro
-
 Morocco
-
 Mozambique
-
 Myanmar
-
 Namibia
-
 Nepal
Nepal
-
 Netherlands
-
 New Zealand
-
 Nigeria
-
 North Macedonia
-
 Norway
-
 Oman
Oman
-
 Pakistan
-
 Palestine
-
 Panama
-
 Papua New Guinea
-
 Paraguay
-
 Peru
Peru
-
 Philippines
-
 Poland
-
 Portugal
-
 Puerto Rico
-
 Qatar
Qatar
-
 Reunion
-
 Romania
-
 Rwanda
-
 Saudi Arabia
-
 Serbia
-
 Singapore
-
 Slovakia
-
 Slovenia
-
 Somalia
-
 South Africa
-
 Spain
Spain
-
 Sri Lanka
-
 Sweden
-
 Switzerland
-
 Syria
Syria
-
 Taiwan
-
 Tajikistan
-
 Tanzania
-
 Thailand
-
 Trinidad and Tobago
-
 Tunisia
-
 Turkey
-
 UAE
UAE
-
 Uganda
-
 Ukraine
-
 United Kingdom
-
United States
-
 Uruguay
-
 Uzbekistan
-
 Venezuela
-
 Vietnam
-
 Yemen
Yemen
-
 Zambia
-
 Zimbabwe
- Forex
- Crypto











