
Why is Sundial Growers stock up today? Resistance test and weak momentum signal shift.

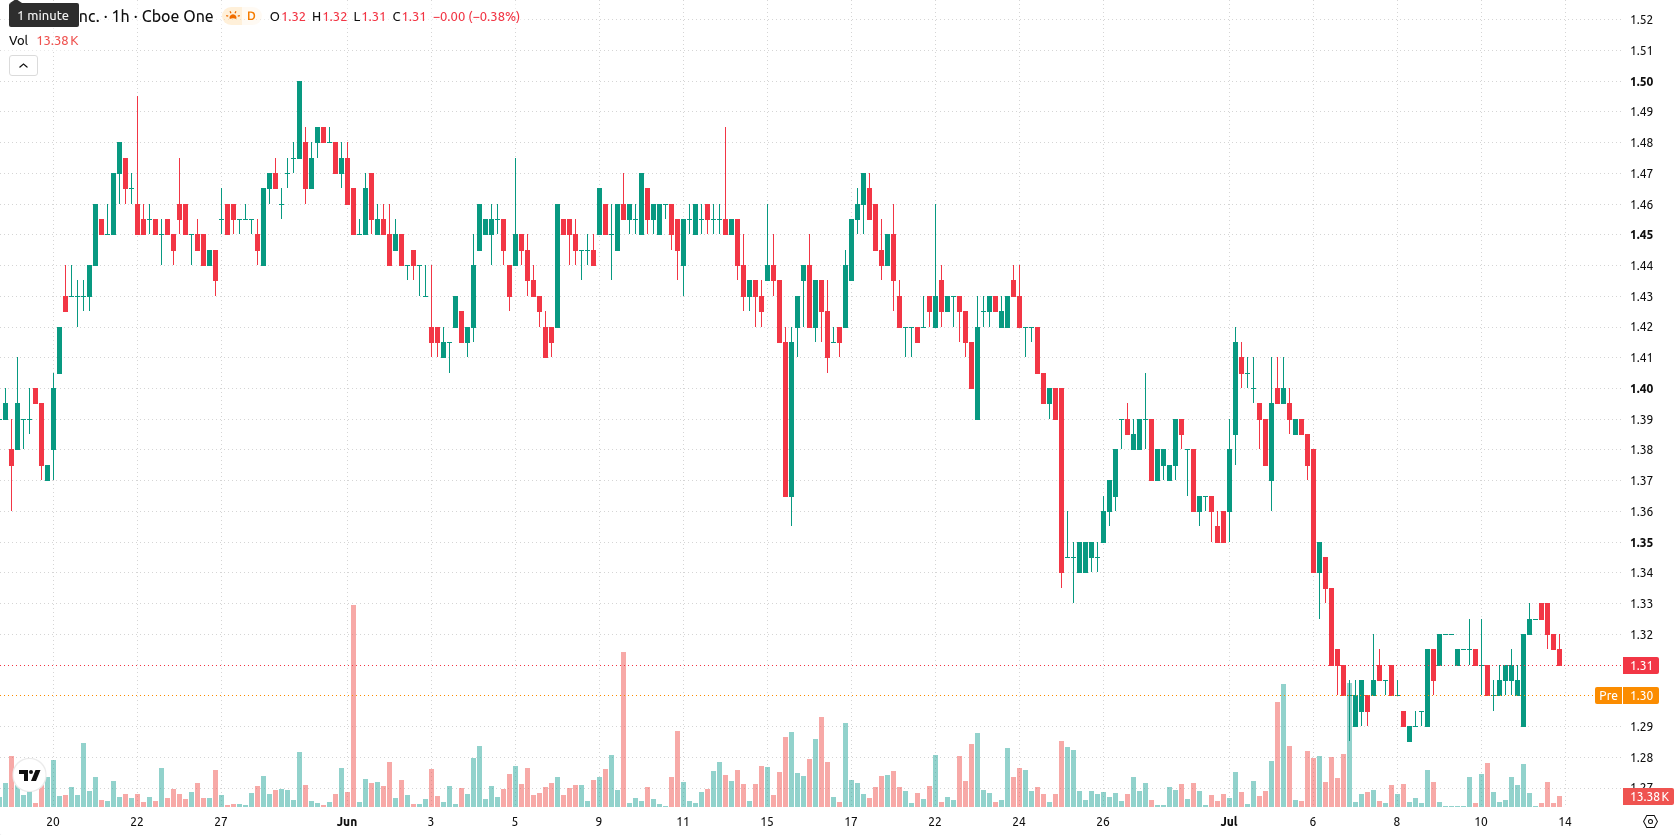
Sundial Growers (SNDL) stock is trading at $1.32, up 1.15% for the day. The price is above its short- and medium-term moving averages, signaling support from recent momentum against longer-term trends.
 1.33
1.34
1.33
1.34
Highlights
- SNDL/USD trades above short and mid-term moving averages, though long-term trend remains bearish and caps upside.
- Momentum and oscillators provide mixed signals, with no strong directional bias and heightened intraday volatility.
- Trading is likely to remain range-bound between $1.29 and $1.35, with a 78% probability of a downside move.
Mixed momentum and resistance as indicators diverge
On the H1 chart, SNDL is fluctuating above the MA-20 at $1.31 and the MA-50 at $1.32, with the Ichimoku Kijun at $1.31 acting as immediate support. The MA-200 at $1.67 remains a significant resistance to further upside. Momentum indicators show a neutral signal on both the Moving Average Convergence Divergence (MACD) and the Awesome Oscillator, while the Average Directional Index (ADX) indicates a Buy bias. The Relative Strength Index (RSI) is near the midpoint of 50 and suggests a Sell reading, while both the Stochastic RSI and the Commodity Channel Index (CCI) are neutral, pointing to a lack of overbought or oversold conditions. Bull/Bear Power gives a Sell signal, highlighting intraday pressure from sellers. High volatility persists, and the divergence among indicators underscores market indecision.
Sideways bias persists as breakout risks remain contained
Over the next few sessions, SNDL is expected to trade within a $1.29 to $1.35 range, reflecting typical volatility at current levels. There is a 22% probability of a break to the upside, while the likelihood of a move downward stands at 78%. The baseline scenario anticipates sideways action within the corridor. A bullish outlook would require a clear breach of resistance, whereas a bearish case would see the price drop convincingly below immediate support.
Earlier, analysts noted that Sundial Growers was experiencing persistent bearish pressure, with limited signs of a near-term reversal. The current market indecision, coupled with heightened volatility and mixed momentum signals, highlights the need for traders to closely monitor any decisive move outside the $1.29 to $1.35 range for potential directional cues.







-
 Afghanistan
-
 Albania
-
 Algeria
-
 Angola
-
 Argentina
-
 Armenia
-
 Australia
-
 Austria
-
 Azerbaijan
-
 Bahamas
-
 Bahrain
-
 Bangladesh
-
 Belarus
-
 Belgium
-
 Bolivia
-
 Botswana
-
 Brazil
-
 Brunei
-
 Bulgaria
-
 Cambodia
-
 Cameroon
-
 Canada
-
 Chile
Chile
-
 China
China
-
 Colombia
-
 Congo
Congo
-
 Costa Rica
-
 Cote d'Ivoire
-
 Croatia
-
 Cuba
Cuba
-
 Cyprus
-
 Czechia
-
 DR Congo
-
 Denmark
-
 Dominican Republic
-
 Ecuador
-
 Egypt
Egypt
-
 El Salvador
-
 Estonia
-
 Eswatini
-
 Ethiopia
-
 Finland
-
 France
-
 Georgia
-
 Germany
-
 Ghana
Ghana
-
 Greece
-
 Haiti
Haiti
-
 Hong Kong
-
 Hungary
-
 India
India
-
 Indonesia
-
 Iran, Islamic republic
-
 Iraq
Iraq
-
 Ireland
-
 Israel
-
 Italy
Italy
-
 Jamaica
-
 Japan
Japan
-
 Jordan
-
 Kazakhstan
-
 Kenya
Kenya
-
 Korea
Korea
-
 Kuwait
-
 Kyrgyzstan
-
 Laos
Laos
-
 Latvia
-
 Lebanon
-
 Lesotho
-
 Libya
Libya
-
 Lithuania
-
 Luxembourg
-
 Madagascar
-
 Malaysia
-
 Malta
Malta
-
 Mauritius
-
 Mexico
-
 Moldova
-
 Mongolia
-
 Montenegro
-
 Morocco
-
 Mozambique
-
 Myanmar
-
 Namibia
-
 Nepal
Nepal
-
 Netherlands
-
 New Zealand
-
 Nigeria
-
 North Macedonia
-
 Norway
-
 Oman
Oman
-
 Pakistan
-
 Palestine
-
 Panama
-
 Papua New Guinea
-
 Paraguay
-
 Peru
Peru
-
 Philippines
-
 Poland
-
 Portugal
-
 Puerto Rico
-
 Qatar
Qatar
-
 Reunion
-
 Romania
-
 Rwanda
-
 Saudi Arabia
-
 Serbia
-
 Singapore
-
 Slovakia
-
 Slovenia
-
 Somalia
-
 South Africa
-
 Spain
Spain
-
 Sri Lanka
-
 Sweden
-
 Switzerland
-
 Syria
Syria
-
 Taiwan
-
 Tajikistan
-
 Tanzania
-
 Thailand
-
 Trinidad and Tobago
-
 Tunisia
-
 Turkey
-
 UAE
UAE
-
 Uganda
-
 Ukraine
-
 United Kingdom
-
United States
-
 Uruguay
-
 Uzbekistan
-
 Venezuela
-
 Vietnam
-
 Yemen
Yemen
-
 Zambia
-
 Zimbabwe
- Forex
- Crypto











