
SNDL trades flat as seller pressure keeps gains capped

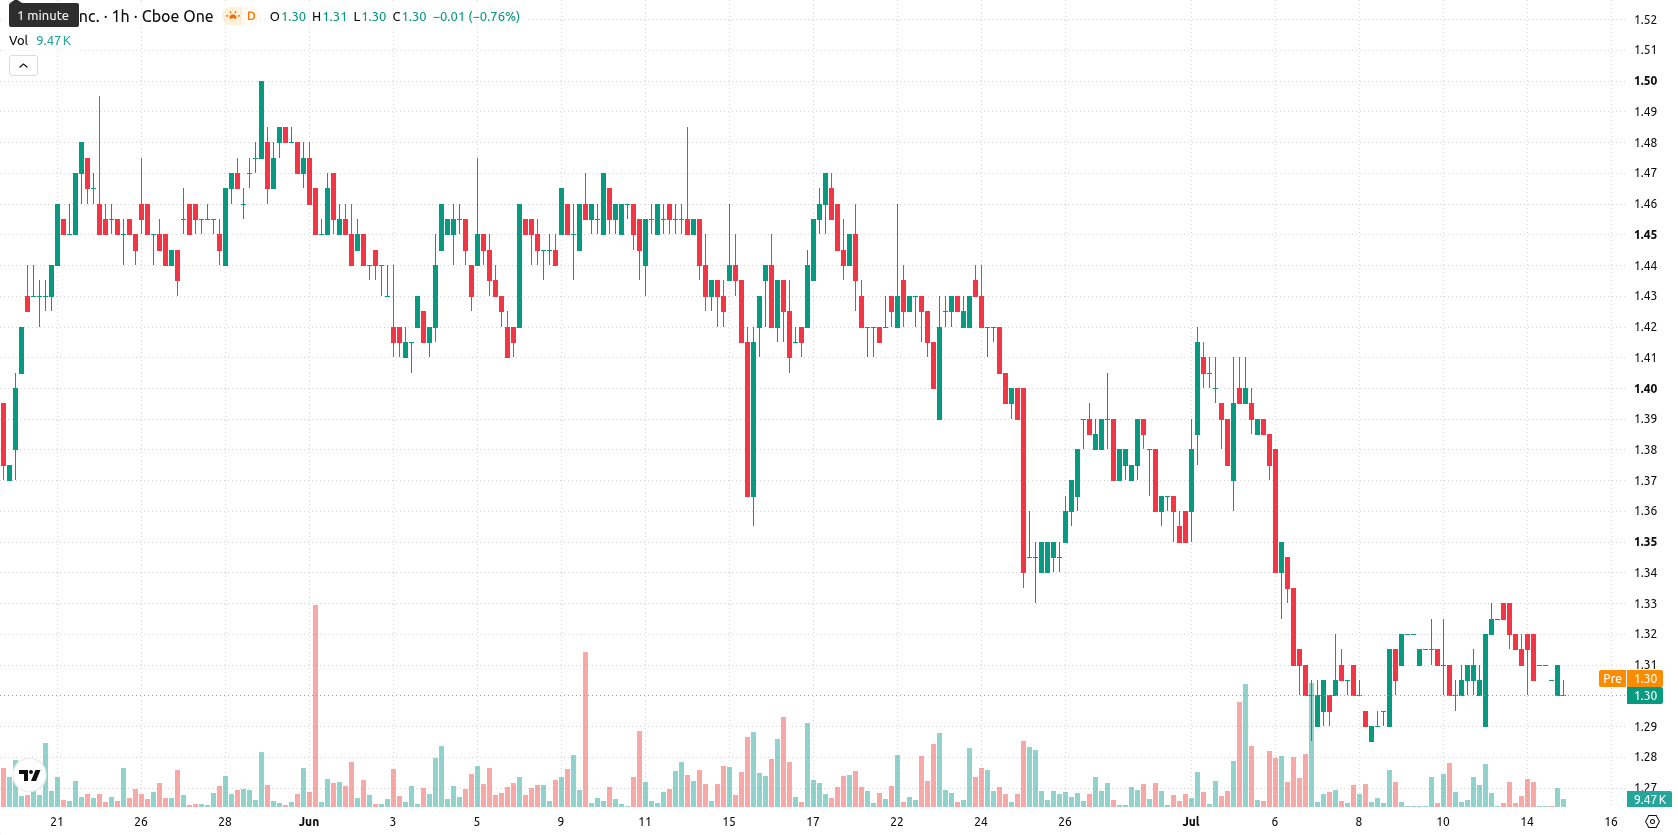
Sundial Growers (SNDL) stock is trading at $1.3 after a modest decline in the latest session. The price remains below key moving averages, indicating a near-term loss of momentum.
 1.33
1.34
1.33
1.34
Highlights
- SNDL remains in a pronounced bearish trend, trading below key moving averages across all observed timeframes.
- Price action is dominated by sellers, with most momentum indicators confirming downside pressure and persistent intraday weakness.
- For the next sessions, SNDL is likely to fluctuate between $1.27 and $1.33, with heightened risk of breaking below support.
Technical barriers and negative signals reinforce downside momentum
On the hourly timeframe, SNDL is currently positioned below the 20-hour ($1.31), 50-hour ($1.31), and 200-hour ($1.66) moving averages. The Ichimoku Kijun sits at $1.32, acting as immediate resistance, while support is found at $1.27. The Relative Strength Index (RSI) is at 42.38, and the Commodity Channel Index (CCI) signals a sell stance, both reflecting broad downside pressure. The Moving Average Convergence Divergence (MACD) shows a sell signal, while the Average Directional Index (ADX) reports neutral trend strength. The Stochastic RSI is in oversold territory, hinting at possible short-term exhaustion, and the Bull/Bear Power (BBP) as well as the Awesome Oscillator continue to align with prevailing negative intraday momentum.
Downside risk persists as resistance and support levels dictate outlook
Looking ahead over the next few sessions, SNDL is expected to fluctuate within the $1.27–$1.33 price band, representing a typical volatility range relative to current levels. The probability of further downside remains significant, with a low likelihood of a sustained rebound at this stage. If buying pressure were to increase and the price breaks above the $1.32 resistance level, it could mark the first sign of a potential reversal. Conversely, failure to hold the $1.27 support may result in continued weakness.
Earlier, analysts noted persistent market indecision for Sundial Growers as mixed momentum indicators highlighted the need for closely monitoring directional cues. The latest technical developments reinforce this uncertainty, making the $1.32 resistance a critical threshold for traders to assess the prospects of a near-term rebound.







-
 Afghanistan
-
 Albania
-
 Algeria
-
 Angola
-
 Argentina
-
 Armenia
-
 Australia
-
 Austria
-
 Azerbaijan
-
 Bahamas
-
 Bahrain
-
 Bangladesh
-
 Belarus
-
 Belgium
-
 Bolivia
-
 Botswana
-
 Brazil
-
 Brunei
-
 Bulgaria
-
 Cambodia
-
 Cameroon
-
 Canada
-
 Chile
Chile
-
 China
China
-
 Colombia
-
 Congo
Congo
-
 Costa Rica
-
 Cote d'Ivoire
-
 Croatia
-
 Cuba
Cuba
-
 Cyprus
-
 Czechia
-
 DR Congo
-
 Denmark
-
 Dominican Republic
-
 Ecuador
-
 Egypt
Egypt
-
 El Salvador
-
 Estonia
-
 Eswatini
-
 Ethiopia
-
 Finland
-
 France
-
 Georgia
-
 Germany
-
 Ghana
Ghana
-
 Greece
-
 Haiti
Haiti
-
 Hong Kong
-
 Hungary
-
 India
India
-
 Indonesia
-
 Iran, Islamic republic
-
 Iraq
Iraq
-
 Ireland
-
 Israel
-
 Italy
Italy
-
 Jamaica
-
 Japan
Japan
-
 Jordan
-
 Kazakhstan
-
 Kenya
Kenya
-
 Korea
Korea
-
 Kuwait
-
 Kyrgyzstan
-
 Laos
Laos
-
 Latvia
-
 Lebanon
-
 Lesotho
-
 Libya
Libya
-
 Lithuania
-
 Luxembourg
-
 Madagascar
-
 Malaysia
-
 Malta
Malta
-
 Mauritius
-
 Mexico
-
 Moldova
-
 Mongolia
-
 Montenegro
-
 Morocco
-
 Mozambique
-
 Myanmar
-
 Namibia
-
 Nepal
Nepal
-
 Netherlands
-
 New Zealand
-
 Nigeria
-
 North Macedonia
-
 Norway
-
 Oman
Oman
-
 Pakistan
-
 Palestine
-
 Panama
-
 Papua New Guinea
-
 Paraguay
-
 Peru
Peru
-
 Philippines
-
 Poland
-
 Portugal
-
 Puerto Rico
-
 Qatar
Qatar
-
 Reunion
-
 Romania
-
 Rwanda
-
 Saudi Arabia
-
 Serbia
-
 Singapore
-
 Slovakia
-
 Slovenia
-
 Somalia
-
 South Africa
-
 Spain
Spain
-
 Sri Lanka
-
 Sweden
-
 Switzerland
-
 Syria
Syria
-
 Taiwan
-
 Tajikistan
-
 Tanzania
-
 Thailand
-
 Trinidad and Tobago
-
 Tunisia
-
 Turkey
-
 UAE
UAE
-
 Uganda
-
 Ukraine
-
 United Kingdom
-
United States
-
 Uruguay
-
 Uzbekistan
-
 Venezuela
-
 Vietnam
-
 Yemen
Yemen
-
 Zambia
-
 Zimbabwe
- Forex
- Crypto











