
QUBT jumps as thin-film lithium niobate photonic chip innovation drives fresh buying

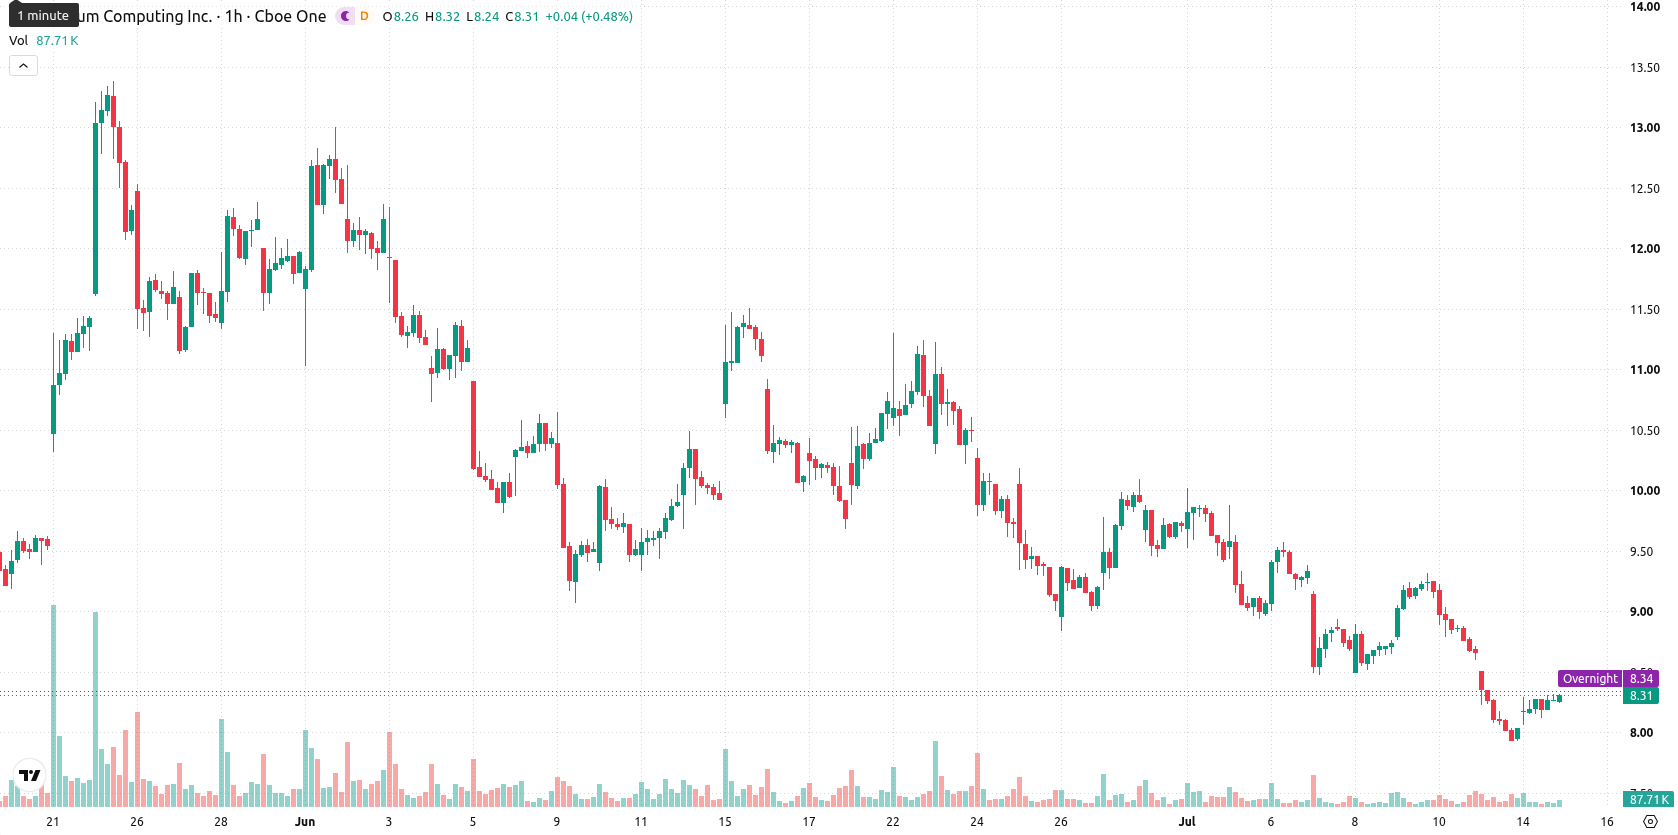
Quantum Computing (QUBT) stock is trading at $8.32, up 4% for the day. The price action sits below its key moving averages amidst heightened intraday volatility.
 8.32
9.33
8.32
9.33
Highlights
- Quantum Computing Inc. advances proprietary photonic chips using thin-film lithium niobate, targeting increased efficiency for commercial and government clients.
- The company's focus on photonics-based solutions positions it to benefit from specialized adoption and sustained client demand in next-generation quantum technology.
- QUBT trades below major moving averages, with technical indicators showing bearish momentum and an expected range of $7.69 to $8.95 over the next 2–3 days.
Client-driven uptake as photonic innovation lifts growth outlook
Quantum Computing Inc. is advancing its position in the quantum technology space by developing photonics-based equipment for both commercial and government clients, a move highlighted by its focus on thin-film lithium niobate (TFLN) photonic chips that convert electrical signals into optical signals, according to Insidermonkey. This innovation offers enhanced efficiency and performance in photonic computing components, which can drive increased adoption in specialized applications. The company's emphasis on proprietary photonic solutions supports its growth outlook as it addresses the evolving needs of its client base.
Divergent oscillator signals amid bearish momentum and resistance test
On the H1 timeframe, QUBT trades below the MA-20 at $8.36 and MA-50 at $8.74, while on the daily chart, it remains under the MA-200 at $11.14. The Ichimoku Kijun is positioned at $8.63, acting as near-term resistance. Momentum readings show the Moving Average Convergence Divergence (MACD) at Strong Sell and the Average Directional Index (ADX) signaling Sell, while the Relative Strength Index (RSI) sits at 43.27, reinforcing a Sell stance. Notably, the Stochastic RSI registers as Overbought and the Commodity Channel Index (CCI) stands at Neutral, evidencing a divergence among oscillators. The Bull/Bear Power indicates Strong Buy, reflecting some buyer activity intraday, while the Awesome Oscillator holds a Neutral reading.
Directional bias favors downside as rangebound pattern dominates
Looking ahead over the next two to three trading days, QUBT is expected to trade within a range of $7.69 to $8.95, reflecting typical volatility bands relative to current conditions. A breakout above immediate resistance at $8.63 would increase the probability of further gains, though such a scenario currently holds a 35% likelihood. Conversely, a break below $7.69 would likely accelerate downward movement, aligned with a 65% probability of continued declines. The baseline expectation is for the stock to remain rangebound between these key technical levels.
Earlier, analysts noted that Quantum Computing Inc. faced persistent bearish momentum, with technical indicators favoring sellers despite occasional short-term rebounds. As current oscillators reveal mixed signals—suggesting both ongoing downside risk and emerging buyer interest—investors should monitor the $8.63 resistance level for any potential shift in trend direction in the coming sessions.


Latest Quantum Computing News






-
 Afghanistan
-
 Albania
-
 Algeria
-
 Angola
-
 Argentina
-
 Armenia
-
 Australia
-
 Austria
-
 Azerbaijan
-
 Bahamas
-
 Bahrain
-
 Bangladesh
-
 Belarus
-
 Belgium
-
 Bolivia
-
 Botswana
-
 Brazil
-
 Brunei
-
 Bulgaria
-
 Cambodia
-
 Cameroon
-
 Canada
-
 Chile
Chile
-
 China
China
-
 Colombia
-
 Congo
Congo
-
 Costa Rica
-
 Cote d'Ivoire
-
 Croatia
-
 Cuba
Cuba
-
 Cyprus
-
 Czechia
-
 DR Congo
-
 Denmark
-
 Dominican Republic
-
 Ecuador
-
 Egypt
Egypt
-
 El Salvador
-
 Estonia
-
 Eswatini
-
 Ethiopia
-
 Finland
-
 France
-
 Georgia
-
 Germany
-
 Ghana
Ghana
-
 Greece
-
 Haiti
Haiti
-
 Hong Kong
-
 Hungary
-
 India
India
-
 Indonesia
-
 Iran, Islamic republic
-
 Iraq
Iraq
-
 Ireland
-
 Israel
-
 Italy
Italy
-
 Jamaica
-
 Japan
Japan
-
 Jordan
-
 Kazakhstan
-
 Kenya
Kenya
-
 Korea
Korea
-
 Kuwait
-
 Kyrgyzstan
-
 Laos
Laos
-
 Latvia
-
 Lebanon
-
 Lesotho
-
 Libya
Libya
-
 Lithuania
-
 Luxembourg
-
 Madagascar
-
 Malaysia
-
 Malta
Malta
-
 Mauritius
-
 Mexico
-
 Moldova
-
 Mongolia
-
 Montenegro
-
 Morocco
-
 Mozambique
-
 Myanmar
-
 Namibia
-
 Nepal
Nepal
-
 Netherlands
-
 New Zealand
-
 Nigeria
-
 North Macedonia
-
 Norway
-
 Oman
Oman
-
 Pakistan
-
 Palestine
-
 Panama
-
 Papua New Guinea
-
 Paraguay
-
 Peru
Peru
-
 Philippines
-
 Poland
-
 Portugal
-
 Puerto Rico
-
 Qatar
Qatar
-
 Reunion
-
 Romania
-
 Rwanda
-
 Saudi Arabia
-
 Serbia
-
 Singapore
-
 Slovakia
-
 Slovenia
-
 Somalia
-
 South Africa
-
 Spain
Spain
-
 Sri Lanka
-
 Sweden
-
 Switzerland
-
 Syria
Syria
-
 Taiwan
-
 Tajikistan
-
 Tanzania
-
 Thailand
-
 Trinidad and Tobago
-
 Tunisia
-
 Turkey
-
 UAE
UAE
-
 Uganda
-
 Ukraine
-
 United Kingdom
-
United States
-
 Uruguay
-
 Uzbekistan
-
 Venezuela
-
 Vietnam
-
 Yemen
Yemen
-
 Zambia
-
 Zimbabwe
- Forex
- Crypto











