
Possible buyer exhaustion dampens rally. Can Affirm stock avoid deeper losses?

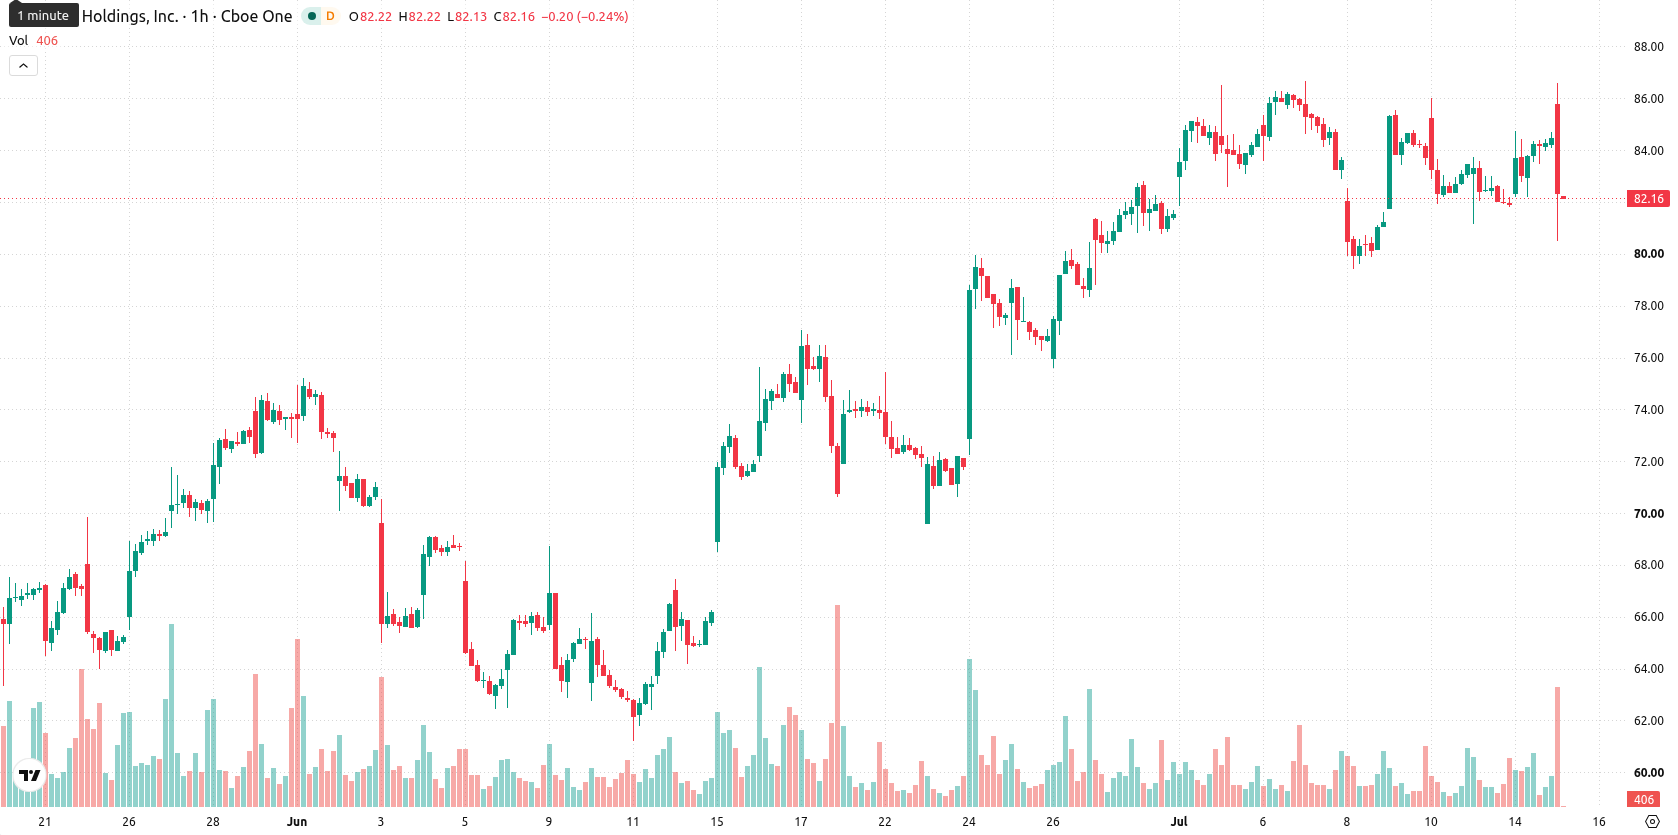
Affirm (AFRM) stock is trading at $81.89 after a daily decline of 3.03%. The price sits below its key moving averages on short- and mid-term horizons while retaining support above its long-term average.
 86.00
85.80
86.00
85.80
Highlights
- AFRM/USD faces sustained short- and mid-term selling pressure, trading below key short-term moving averages.
- Momentum indicators present conflicting signals, with mixed buy, neutral, and overbought readings signaling uncertain buyer strength.
- Price is expected to consolidate between $79.79 and $83.99; a downside move is favored unless $83.58 resistance is surpassed.
Buy signal and overbought conditions shape mixed technical outlook
On the hourly chart, AFRM is trading below both the 20-period moving average at $83.17 and the 50-period moving average at $83.5, while remaining above the 200-period moving average on the daily timeframe at $66.19. Immediate resistance is identified at the Ichimoku Kijun level of $83.58. The latest readings from the Moving Average Convergence Divergence (MACD) suggest a buy signal, with the Average Directional Index (ADX) neutral, indicating limited trend strength. The Relative Strength Index (RSI) stands at 62.65, supportive of buying momentum, but the Stochastic RSI, Commodity Channel Index (CCI), and Bull/Bear Power are all in overbought territory, highlighting the potential for buyer exhaustion. The Awesome Oscillator is currently aligned with positive momentum, but mixed oscillator readings illustrate the prevailing uncertainty in near-term price action.
Sideways bias persists as upside hinges on resistance breakout
AFRM is expected to trade within a range of $79.79 to $83.99 over the coming sessions, with the probability of an upward move assessed at 38%. The base-case scenario envisions sideways action within this corridor. A bullish scenario would require a close above resistance at $83.58, while a decisive break below the lower bound would open the door to further downside.
Earlier, analysts noted that Affirm was seen as a potential candidate for inclusion in the S&P 500, reflecting its growing stature among large-cap financial technology stocks. While the immediate technical outlook suggests limited upside momentum, traders should watch for a confirmed break above $83.58 as a catalyst for renewed buying interest.


Latest Affirm News







-
 Afghanistan
-
 Albania
-
 Algeria
-
 Angola
-
 Argentina
-
 Armenia
-
 Australia
-
 Austria
-
 Azerbaijan
-
 Bahamas
-
 Bahrain
-
 Bangladesh
-
 Belarus
-
 Belgium
-
 Bolivia
-
 Botswana
-
 Brazil
-
 Brunei
-
 Bulgaria
-
 Cambodia
-
 Cameroon
-
 Canada
-
 Chile
Chile
-
 China
China
-
 Colombia
-
 Congo
Congo
-
 Costa Rica
-
 Cote d'Ivoire
-
 Croatia
-
 Cuba
Cuba
-
 Cyprus
-
 Czechia
-
 DR Congo
-
 Denmark
-
 Dominican Republic
-
 Ecuador
-
 Egypt
Egypt
-
 El Salvador
-
 Estonia
-
 Eswatini
-
 Ethiopia
-
 Finland
-
 France
-
 Georgia
-
 Germany
-
 Ghana
Ghana
-
 Greece
-
 Haiti
Haiti
-
 Hong Kong
-
 Hungary
-
 India
India
-
 Indonesia
-
 Iran, Islamic republic
-
 Iraq
Iraq
-
 Ireland
-
 Israel
-
 Italy
Italy
-
 Jamaica
-
 Japan
Japan
-
 Jordan
-
 Kazakhstan
-
 Kenya
Kenya
-
 Korea
Korea
-
 Kuwait
-
 Kyrgyzstan
-
 Laos
Laos
-
 Latvia
-
 Lebanon
-
 Lesotho
-
 Libya
Libya
-
 Lithuania
-
 Luxembourg
-
 Madagascar
-
 Malaysia
-
 Malta
Malta
-
 Mauritius
-
 Mexico
-
 Moldova
-
 Mongolia
-
 Montenegro
-
 Morocco
-
 Mozambique
-
 Myanmar
-
 Namibia
-
 Nepal
Nepal
-
 Netherlands
-
 New Zealand
-
 Nigeria
-
 North Macedonia
-
 Norway
-
 Oman
Oman
-
 Pakistan
-
 Palestine
-
 Panama
-
 Papua New Guinea
-
 Paraguay
-
 Peru
Peru
-
 Philippines
-
 Poland
-
 Portugal
-
 Puerto Rico
-
 Qatar
Qatar
-
 Reunion
-
 Romania
-
 Rwanda
-
 Saudi Arabia
-
 Serbia
-
 Singapore
-
 Slovakia
-
 Slovenia
-
 Somalia
-
 South Africa
-
 Spain
Spain
-
 Sri Lanka
-
 Sweden
-
 Switzerland
-
 Syria
Syria
-
 Taiwan
-
 Tajikistan
-
 Tanzania
-
 Thailand
-
 Trinidad and Tobago
-
 Tunisia
-
 Turkey
-
 UAE
UAE
-
 Uganda
-
 Ukraine
-
 United Kingdom
-
United States
-
 Uruguay
-
 Uzbekistan
-
 Venezuela
-
 Vietnam
-
 Yemen
Yemen
-
 Zambia
-
 Zimbabwe
- Forex
- Crypto











