
MyFirstEV rebate law signed in California supports Tesla stock near $386.12–$405.98 range

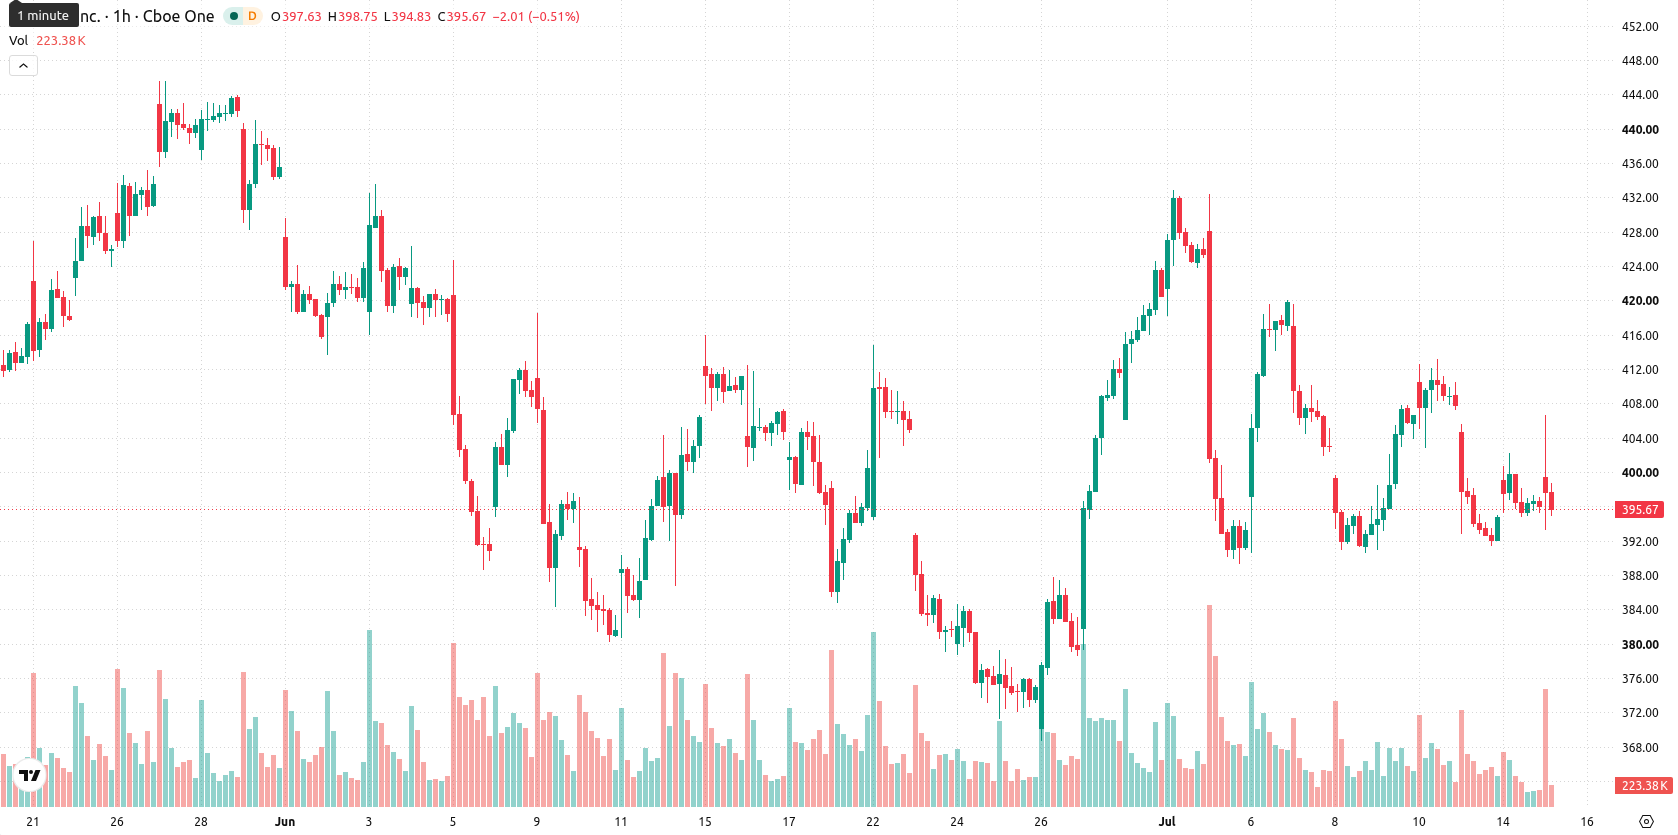
Tesla (TSLA) stock is trading at $396.05 after a modest gain today, remaining under its key moving averages. The price action reflects persistent challenges for buyers within the prevailing session.
 399.23
413.06
399.23
413.06
Highlights
- Tesla's Q2 2026 earnings call on July 22 is a focal point as investors await new financial disclosures.
- Expansion of Full Self-Driving features and the MyFirstEV rebate in California enhance demand drivers and operational scale.
- TSLA remains under selling pressure with a high likelihood of continued consolidation within the $386.12 to $405.98 range.
Earnings anticipation and policy tailwinds bolster demand outlook
Tesla's upcoming Q2 2026 earnings call, scheduled for July 22 according to Teslaoracle, is drawing investor attention as markets prepare for new financial disclosures and updates from CEO Elon Musk and the executive team. The company has also advanced its autonomous driving initiatives, launching the Full Self-Driving (FSD) Supervised version 14.3.5 with enhanced features, as reported by Not a Tesla App, while users in several European countries have surpassed 50 million kilometres driven under regulatory approval, per Teslanorth. Demand drivers include the recent signing of the MyFirstEV rebate program into law in California, enabling up to $3,500 off new Tesla vehicles below $50,000, as noted by Teslarati, and further operational expansion is seen in the rollout of Robotaxi service to Miami, Florida.
Bearish momentum as Tesla lingers below key averages
Technically, TSLA is positioned below the MA-20 at $399.75 and MA-50 at $402.72 on the hourly chart, as well as beneath the MA-200 at $417.71 on the daily chart. Immediate resistance stands at the Ichimoku Kijun level of $402.27, while key support is marked around $386.12. The Relative Strength Index (RSI) is at 42.17, displaying a bearish bias, with the Commodity Channel Index (CCI) and Bull/Bear Power both indicating oversold conditions. The Moving Average Convergence Divergence (MACD) remains on Sell, Average Directional Index (ADX) is Neutral, and the Awesome Oscillator continues to reflect downside momentum, while the Stochastic RSI signals a neutral stance.
Downside risk prevails as narrow trading band limits upside
In the short term, TSLA is expected to trade within a band of $386.12 to $405.98, based on prevailing volatility. Scenario analysis shows a very high probability of further downward movement, with strong resistance anticipated near $402.27 and key support at $386.12. Price consolidation within this range is likely unless a decisive breakout occurs, with bullish follow-through requiring a sustained move above the immediate resistance zone.
Previously it was reported that Tesla stock was struggling to overcome technical resistance amid persistent bearish momentum. The latest developments reinforce this cautious stance, with continued downside pressure elevating the importance of monitoring the $402.27 resistance level as a potential inflection point for any shift in trend.









-
 Afghanistan
-
 Albania
-
 Algeria
-
 Angola
-
 Argentina
-
 Armenia
-
 Australia
-
 Austria
-
 Azerbaijan
-
 Bahamas
-
 Bahrain
-
 Bangladesh
-
 Belarus
-
 Belgium
-
 Bolivia
-
 Botswana
-
 Brazil
-
 Brunei
-
 Bulgaria
-
 Cambodia
-
 Cameroon
-
 Canada
-
 Chile
Chile
-
 China
China
-
 Colombia
-
 Congo
Congo
-
 Costa Rica
-
 Cote d'Ivoire
-
 Croatia
-
 Cuba
Cuba
-
 Cyprus
-
 Czechia
-
 DR Congo
-
 Denmark
-
 Dominican Republic
-
 Ecuador
-
 Egypt
Egypt
-
 El Salvador
-
 Estonia
-
 Eswatini
-
 Ethiopia
-
 Finland
-
 France
-
 Georgia
-
 Germany
-
 Ghana
Ghana
-
 Greece
-
 Haiti
Haiti
-
 Hong Kong
-
 Hungary
-
 India
India
-
 Indonesia
-
 Iran, Islamic republic
-
 Iraq
Iraq
-
 Ireland
-
 Israel
-
 Italy
Italy
-
 Jamaica
-
 Japan
Japan
-
 Jordan
-
 Kazakhstan
-
 Kenya
Kenya
-
 Korea
Korea
-
 Kuwait
-
 Kyrgyzstan
-
 Laos
Laos
-
 Latvia
-
 Lebanon
-
 Lesotho
-
 Libya
Libya
-
 Lithuania
-
 Luxembourg
-
 Madagascar
-
 Malaysia
-
 Malta
Malta
-
 Mauritius
-
 Mexico
-
 Moldova
-
 Mongolia
-
 Montenegro
-
 Morocco
-
 Mozambique
-
 Myanmar
-
 Namibia
-
 Nepal
Nepal
-
 Netherlands
-
 New Zealand
-
 Nigeria
-
 North Macedonia
-
 Norway
-
 Oman
Oman
-
 Pakistan
-
 Palestine
-
 Panama
-
 Papua New Guinea
-
 Paraguay
-
 Peru
Peru
-
 Philippines
-
 Poland
-
 Portugal
-
 Puerto Rico
-
 Qatar
Qatar
-
 Reunion
-
 Romania
-
 Rwanda
-
 Saudi Arabia
-
 Serbia
-
 Singapore
-
 Slovakia
-
 Slovenia
-
 Somalia
-
 South Africa
-
 Spain
Spain
-
 Sri Lanka
-
 Sweden
-
 Switzerland
-
 Syria
Syria
-
 Taiwan
-
 Tajikistan
-
 Tanzania
-
 Thailand
-
 Trinidad and Tobago
-
 Tunisia
-
 Turkey
-
 UAE
UAE
-
 Uganda
-
 Ukraine
-
 United Kingdom
-
United States
-
 Uruguay
-
 Uzbekistan
-
 Venezuela
-
 Vietnam
-
 Yemen
Yemen
-
 Zambia
-
 Zimbabwe
- Forex
- Crypto











