
Will Tesla stock avoid deeper losses as buyers and sellers face a short-term standoff?

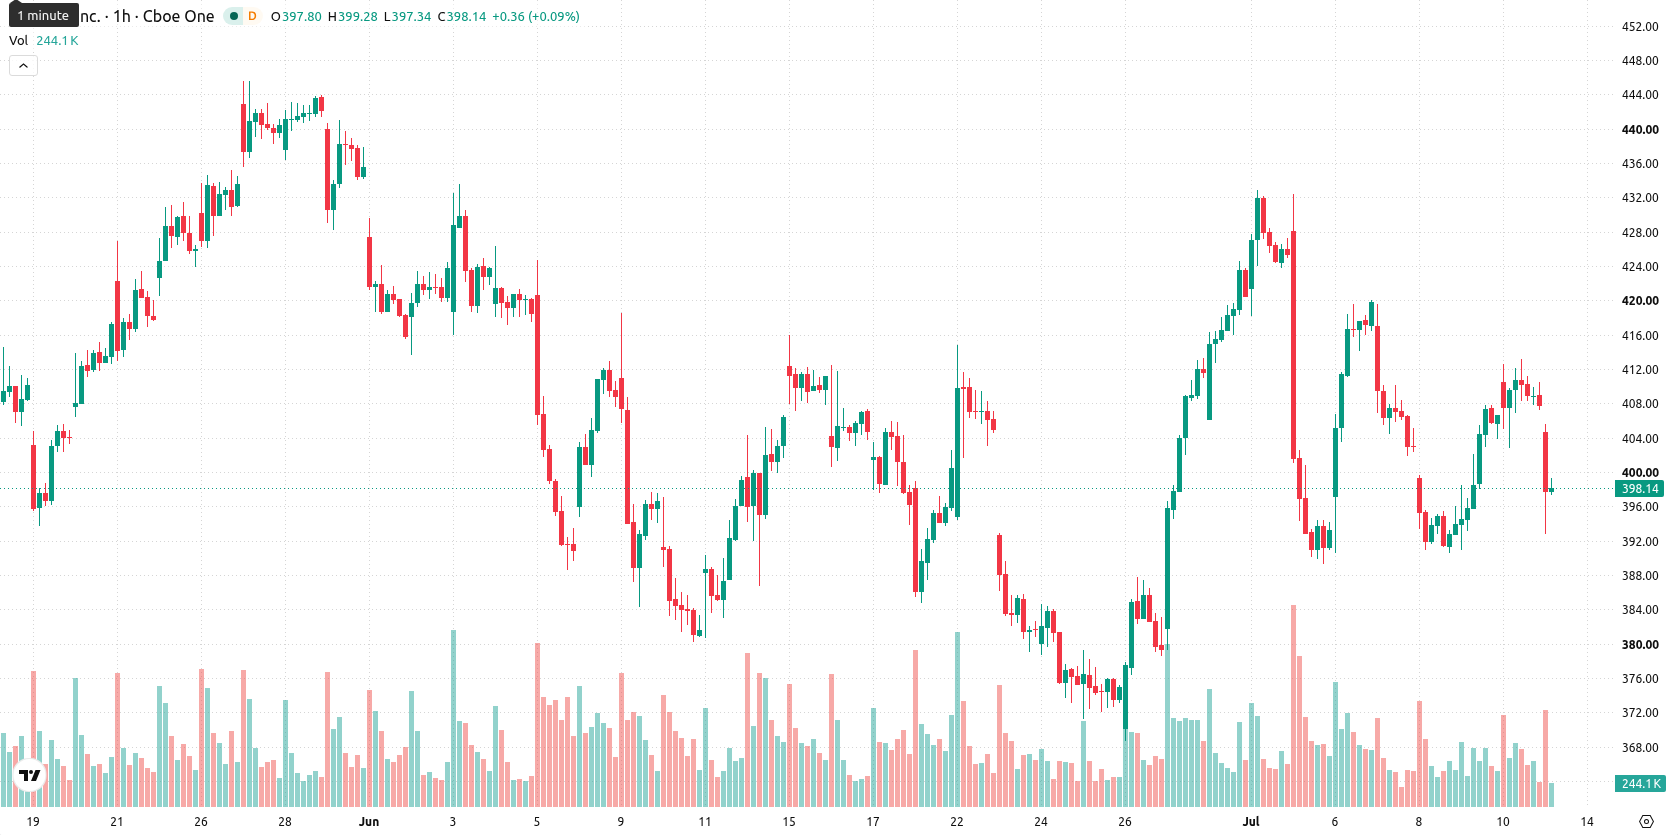
Tesla (TSLA) stock is trading at $398.21, down 2.27% on the day. The price is currently below its key moving averages, indicating a period of short-term and long-term weakness.
 399.28
419.56
399.28
419.56
Highlights
- Tesla outperformed delivery expectations in Q2, shipping over 480,000 vehicles and reinforcing its revenue and demand fundamentals.
- Fremont factory partial shift to Optimus robot production and FSD software expansion indicate ongoing operational evolution supporting core business momentum.
- TSLA trades below major moving averages, with technicals signaling near-term seller control but a 70% likelihood of price consolidating or rebounding within the $385.22–$412.52 range.
Fundamental anchor from delivery beat despite ongoing selling pressure
Tesla reported a strong operational milestone with its second quarter delivery beat, achieving over 480,000 vehicles delivered according to Teslarati. This outcome reflects robust realized demand and efficient execution, directly influencing current revenue and providing a fundamental anchor for the stock. Production adjustments, with segments of Fremont factory capacity redirected to Optimus robot manufacturing, introduced some operational shifts, while the ongoing rollout of Full Self-Driving software version 14.3.5 introduced advanced features such as an always-on Camera Preview and enhanced app notifications, as noted by Basenor. These developments supported company fundamentals though price action has remained under broader selling pressure.
Bullish oscillator signals diverge from daily downside momentum
On the technical side, TSLA is trading below the MA-20 at $401.76 and MA-50 at $406.94 on the H1 chart, with the MA-200 on the daily timeframe at $418.10 marking a higher resistance. The Ichimoku Kijun sits at $401.84 as an immediate resistance level. Short-term indicators present a mixed outlook: the Moving Average Convergence Divergence (MACD) points to a potential buy setup, while the Average Directional Index (ADX) remains neutral. The Relative Strength Index (RSI) is at 54.65 with a buy signal, the Commodity Channel Index (CCI) is bullish, Stochastic RSI is neutral, and Bull/Bear Power is overbought, highlighting diverging signals with oscillators leaning bullish even as daily momentum trends lower.
Upward bias as price consolidates within defined volatility band
Over the next two to three trading days, TSLA is expected to consolidate within a range of $385.22 to $412.52, reflecting a typical volatility band relative to current levels. The base case scenario projects that price will remain in this corridor, with a 70% probability of an upward move and a 30% chance of a downside test. A break above the immediate resistance at the Ichimoku Kijun level could see price target the upper edge of the range, while a move below support would open room toward the lower boundary.
Earlier, analysts noted that Wall Street was taking a cautiously optimistic stance on Tesla highlighting its improved profit outlook amid broader sector enthusiasm for AI and technology-driven growth. The current technical setup suggests that traders should closely monitor the $401.84 Ichimoku Kijun level, as a decisive break above this resistance could signal a shift toward more sustained upside momentum.









-
 Afghanistan
-
 Albania
-
 Algeria
-
 Angola
-
 Argentina
-
 Armenia
-
 Australia
-
 Austria
-
 Azerbaijan
-
 Bahamas
-
 Bahrain
-
 Bangladesh
-
 Belarus
-
 Belgium
-
 Bolivia
-
 Botswana
-
 Brazil
-
 Brunei
-
 Bulgaria
-
 Cambodia
-
 Cameroon
-
 Canada
-
 Chile
Chile
-
 China
China
-
 Colombia
-
 Congo
Congo
-
 Costa Rica
-
 Cote d'Ivoire
-
 Croatia
-
 Cuba
Cuba
-
 Cyprus
-
 Czechia
-
 DR Congo
-
 Denmark
-
 Dominican Republic
-
 Ecuador
-
 Egypt
Egypt
-
 El Salvador
-
 Estonia
-
 Eswatini
-
 Ethiopia
-
 Finland
-
 France
-
 Georgia
-
 Germany
-
 Ghana
Ghana
-
 Greece
-
 Haiti
Haiti
-
 Hong Kong
-
 Hungary
-
 India
India
-
 Indonesia
-
 Iran, Islamic republic
-
 Iraq
Iraq
-
 Ireland
-
 Israel
-
 Italy
Italy
-
 Jamaica
-
 Japan
Japan
-
 Jordan
-
 Kazakhstan
-
 Kenya
Kenya
-
 Korea
Korea
-
 Kuwait
-
 Kyrgyzstan
-
 Laos
Laos
-
 Latvia
-
 Lebanon
-
 Lesotho
-
 Libya
Libya
-
 Lithuania
-
 Luxembourg
-
 Madagascar
-
 Malaysia
-
 Malta
Malta
-
 Mauritius
-
 Mexico
-
 Moldova
-
 Mongolia
-
 Montenegro
-
 Morocco
-
 Mozambique
-
 Myanmar
-
 Namibia
-
 Nepal
Nepal
-
 Netherlands
-
 New Zealand
-
 Nigeria
-
 North Macedonia
-
 Norway
-
 Oman
Oman
-
 Pakistan
-
 Palestine
-
 Panama
-
 Papua New Guinea
-
 Paraguay
-
 Peru
Peru
-
 Philippines
-
 Poland
-
 Portugal
-
 Puerto Rico
-
 Qatar
Qatar
-
 Reunion
-
 Romania
-
 Rwanda
-
 Saudi Arabia
-
 Serbia
-
 Singapore
-
 Slovakia
-
 Slovenia
-
 Somalia
-
 South Africa
-
 Spain
Spain
-
 Sri Lanka
-
 Sweden
-
 Switzerland
-
 Syria
Syria
-
 Taiwan
-
 Tajikistan
-
 Tanzania
-
 Thailand
-
 Trinidad and Tobago
-
 Tunisia
-
 Turkey
-
 UAE
UAE
-
 Uganda
-
 Ukraine
-
 United Kingdom
-
United States
-
 Uruguay
-
 Uzbekistan
-
 Venezuela
-
 Vietnam
-
 Yemen
Yemen
-
 Zambia
-
 Zimbabwe
- Forex
- Crypto











