
What's behind Suncor Energy's latest 2.1% stock pullback?

Suncor Energy Inc. (SU) fell 2.07% after recent institutional outflows, as Hillsdale Investment Management Inc. reduced its stake and changes in analyst sentiment weighed on the shares. The decline is supported by short-term exhaustion signals and resistance near the C$84.14 ceiling, even as the stock maintains bullish momentum above its 20-day and 200-day moving averages.
 86.18
87.51
86.18
87.51
Highlights
- Suncor Energy remains a favored TSX dividend pick due to recent fundamental improvements, despite a downgrade after a share price rise.
- Institutional ownership shifted as Hillsdale cut holdings by 14.5%, reflecting some caution amid ongoing selling pressure.
- Technicals show bullish short- and long-term momentum, with key resistance at C$84.14, and a 5-day trading range forecast of C$81.64–C$86.6.
Institutional reduction tempers optimism despite improved fundamentals
Recent investment articles named Suncor Energy as a leading dividend-paying stock on the TSX Index, citing its forward P/E of 8.9 and a 2.9% dividend yield. The company was reported to have made fundamental improvements over the past year, but a downgrade followed a share price increase. Additionally, Hillsdale Investment Management Inc. decreased its holdings in Suncor Energy by 14.5% during the first quarter, reflecting changes in institutional ownership and analyst sentiment, though price action has remained under broader selling pressure.
Bullish momentum steady as overbought signals and volatility diverge
Suncor Energy is currently trading above its 20-day (C$79.93) and 200-day (C$74.14) moving averages, but below the 50-day moving average (C$85.75). This setup points to bullish momentum on short- and long-term horizons, though medium-term trend pressure remains. The nearest resistance is at C$84.14, with support at the Ichimoku Kijun level near C$82.56. The Relative Strength Index (RSI) at 59.72 signals a buy, while MACD and Average Directional Index (ADX) are neutral. Stochastic RSI, Commodity Channel Index (CCI), and Bull/Bear Power (BBP) all indicate overbought conditions, with BBP highlighting dominant intraday buying activity. The Awesome Oscillator supports continued upward momentum, but the price is near today's low and volatility is elevated at 2.42%. The intraday tone is pressured after the open, reflecting buying exhaustion and divergence among short-term indicators.
Earlier, analysts noted that institutional selling and mixed technical momentum were creating a cautious outlook for Suncor Energy. With new evidence of additional outflows and short-term exhaustion, traders should closely monitor whether SU can sustain its bullish momentum above the C$82.56 support level in the coming week.


Latest Suncor Energy News
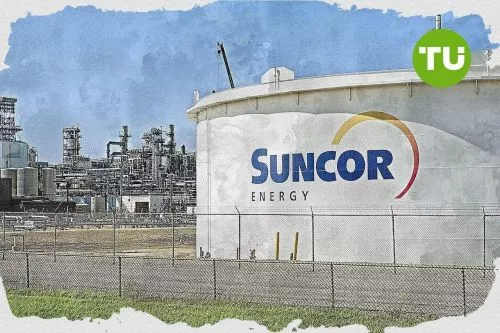





-
 Afghanistan
-
 Albania
-
 Algeria
-
 Angola
-
 Argentina
-
 Armenia
-
 Australia
-
 Austria
-
 Azerbaijan
-
 Bahamas
-
 Bahrain
-
 Bangladesh
-
 Belarus
-
 Belgium
-
 Bolivia
-
 Botswana
-
 Brazil
-
 Brunei
-
 Bulgaria
-
 Cambodia
-
 Cameroon
-
 Canada
-
 Chile
Chile
-
 China
China
-
 Colombia
-
 Congo
Congo
-
 Costa Rica
-
 Cote d'Ivoire
-
 Croatia
-
 Cuba
Cuba
-
 Cyprus
-
 Czechia
-
 DR Congo
-
 Denmark
-
 Dominican Republic
-
 Ecuador
-
 Egypt
Egypt
-
 El Salvador
-
 Estonia
-
 Eswatini
-
 Ethiopia
-
 Finland
-
 France
-
 Georgia
-
 Germany
-
 Ghana
Ghana
-
 Greece
-
 Haiti
Haiti
-
 Hong Kong
-
 Hungary
-
 India
India
-
 Indonesia
-
 Iran, Islamic republic
-
 Iraq
Iraq
-
 Ireland
-
 Israel
-
 Italy
Italy
-
 Jamaica
-
 Japan
Japan
-
 Jordan
-
 Kazakhstan
-
 Kenya
Kenya
-
 Korea
Korea
-
 Kuwait
-
 Kyrgyzstan
-
 Laos
Laos
-
 Latvia
-
 Lebanon
-
 Lesotho
-
 Libya
Libya
-
 Lithuania
-
 Luxembourg
-
 Madagascar
-
 Malaysia
-
 Malta
Malta
-
 Mauritius
-
 Mexico
-
 Moldova
-
 Mongolia
-
 Montenegro
-
 Morocco
-
 Mozambique
-
 Myanmar
-
 Namibia
-
 Nepal
Nepal
-
 Netherlands
-
 New Zealand
-
 Nigeria
-
 North Macedonia
-
 Norway
-
 Oman
Oman
-
 Pakistan
-
 Palestine
-
 Panama
-
 Papua New Guinea
-
 Paraguay
-
 Peru
Peru
-
 Philippines
-
 Poland
-
 Portugal
-
 Puerto Rico
-
 Qatar
Qatar
-
 Reunion
-
 Romania
-
 Rwanda
-
 Saudi Arabia
-
 Serbia
-
 Singapore
-
 Slovakia
-
 Slovenia
-
 Somalia
-
 South Africa
-
 Spain
Spain
-
 Sri Lanka
-
 Sweden
-
 Switzerland
-
 Syria
Syria
-
 Taiwan
-
 Tajikistan
-
 Tanzania
-
 Thailand
-
 Trinidad and Tobago
-
 Tunisia
-
 Turkey
-
 UAE
UAE
-
 Uganda
-
 Ukraine
-
 United Kingdom
-
United States
-
 Uruguay
-
 Uzbekistan
-
 Venezuela
-
 Vietnam
-
 Yemen
Yemen
-
 Zambia
-
 Zimbabwe
- Forex
- Crypto











