
Riot Platforms shares technical analysis: Sellers pressure the near-term trend

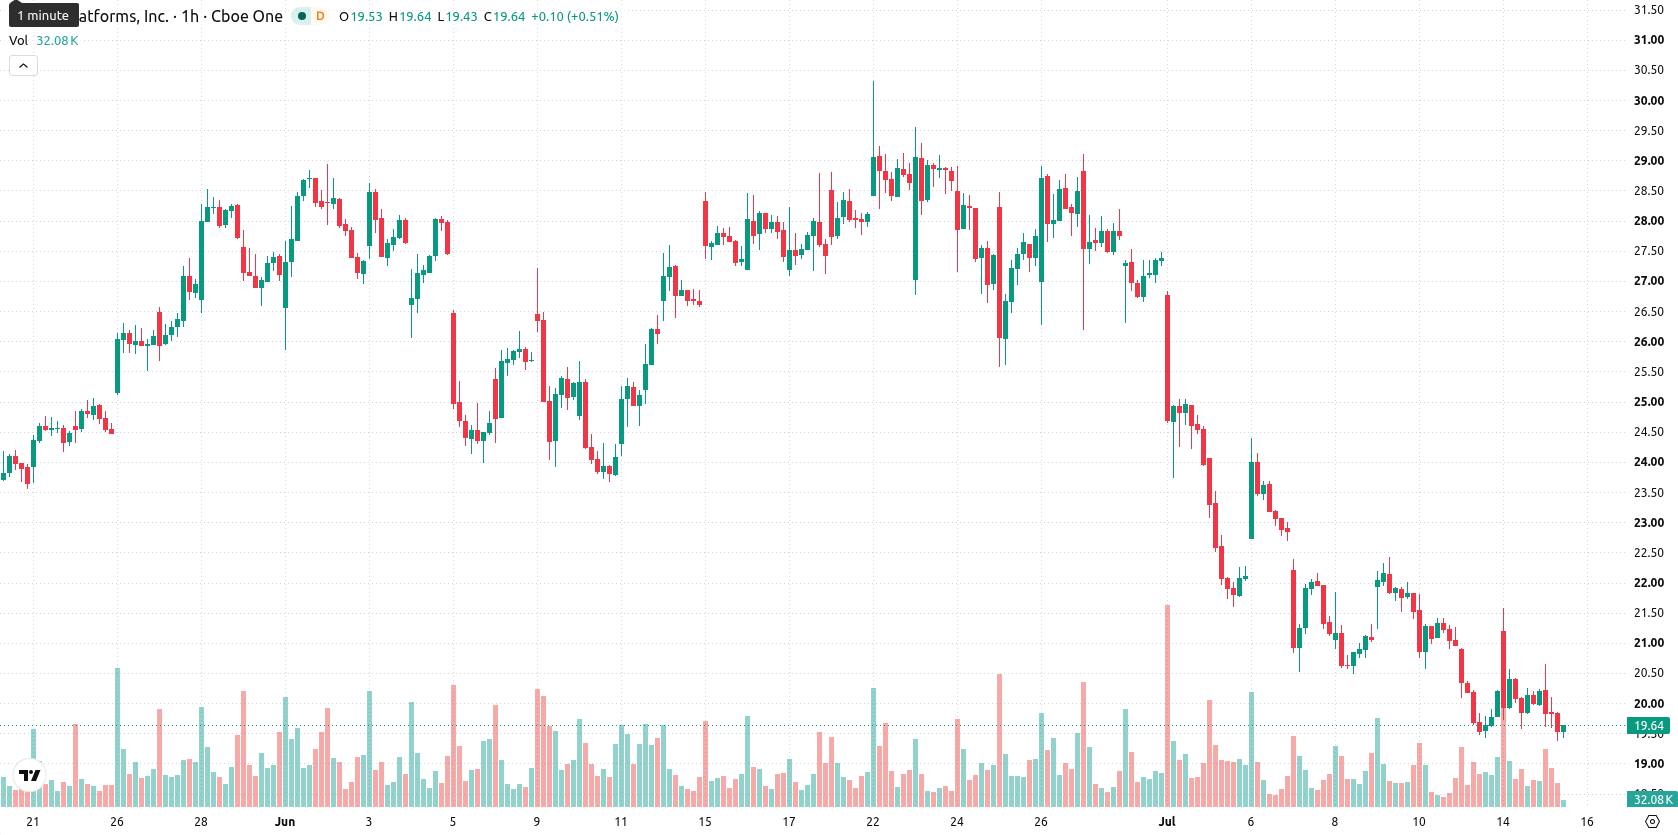
Riot Platforms (RIOT) stock is trading at $19.52, posting a daily decline of 3.32%. The price sits below its key moving averages amid increased volatility.
 20.63
22.42
20.63
22.42
Highlights
- RIOT shows persistent short- and medium-term selling pressure, with price currently trading below major moving averages.
- Momentum indicators such as MACD, ADX, and CCI confirm a clearly bearish outlook, with no signs of immediate reversal or oversold conditions.
- The expected trading range for RIOT is $18.17 to $20.87, with a high probability of further downward movement unless $20.72 resistance is breached.
Technical sell signals align as resistance level caps rebound attempts
On the hourly chart, RIOT has slipped below the 20-period moving average at $20.13 and the 50-period moving average at $21.06, while remaining above the 200-period moving average on the daily timeframe at $18.48. The Ichimoku Kijun on the daily sits at $20.72, now acting as immediate resistance. Among indicators, the Moving Average Convergence Divergence (MACD) remains on Strong Sell, and the Average Directional Index (ADX) is also on Sell; Commodity Channel Index (CCI) confirms the selling bias, and Bull/Bear Power is tilted toward the sellers as well. Relative Strength Index (RSI) reads 40.26, highlighting moderate downward pressure without oversold conditions. Both the Stochastic RSI and Awesome Oscillator are neutral, pointing to a lack of strong reversal signals.
Downside risk elevated as price outlook favors range-bound trade
In the short term, RIOT is expected to trade between $18.17 and $20.87. Upside potential remains limited, while the probability of further downside is considerable. If the resistance at $20.72 is broken, a bullish scenario may materialize. Conversely, a close below $18.17 would confirm a breakdown and invite additional selling pressure. Baseline expectations favor a continuation of sideways movement within the defined volatility band.
Earlier, analysts noted that Riot Platforms faced elevated downside risk amid persistent bearish momentum and a challenging technical landscape. The latest data not only reaffirms these concerns but also underscores the importance of monitoring the $18.17 level, as a decisive move below this threshold could trigger accelerated selling pressure.







-
 Afghanistan
-
 Albania
-
 Algeria
-
 Angola
-
 Argentina
-
 Armenia
-
 Australia
-
 Austria
-
 Azerbaijan
-
 Bahamas
-
 Bahrain
-
 Bangladesh
-
 Belarus
-
 Belgium
-
 Bolivia
-
 Botswana
-
 Brazil
-
 Brunei
-
 Bulgaria
-
 Cambodia
-
 Cameroon
-
 Canada
-
 Chile
Chile
-
 China
China
-
 Colombia
-
 Congo
Congo
-
 Costa Rica
-
 Cote d'Ivoire
-
 Croatia
-
 Cuba
Cuba
-
 Cyprus
-
 Czechia
-
 DR Congo
-
 Denmark
-
 Dominican Republic
-
 Ecuador
-
 Egypt
Egypt
-
 El Salvador
-
 Estonia
-
 Eswatini
-
 Ethiopia
-
 Finland
-
 France
-
 Georgia
-
 Germany
-
 Ghana
Ghana
-
 Greece
-
 Haiti
Haiti
-
 Hong Kong
-
 Hungary
-
 India
India
-
 Indonesia
-
 Iran, Islamic republic
-
 Iraq
Iraq
-
 Ireland
-
 Israel
-
 Italy
Italy
-
 Jamaica
-
 Japan
Japan
-
 Jordan
-
 Kazakhstan
-
 Kenya
Kenya
-
 Korea
Korea
-
 Kuwait
-
 Kyrgyzstan
-
 Laos
Laos
-
 Latvia
-
 Lebanon
-
 Lesotho
-
 Libya
Libya
-
 Lithuania
-
 Luxembourg
-
 Madagascar
-
 Malaysia
-
 Malta
Malta
-
 Mauritius
-
 Mexico
-
 Moldova
-
 Mongolia
-
 Montenegro
-
 Morocco
-
 Mozambique
-
 Myanmar
-
 Namibia
-
 Nepal
Nepal
-
 Netherlands
-
 New Zealand
-
 Nigeria
-
 North Macedonia
-
 Norway
-
 Oman
Oman
-
 Pakistan
-
 Palestine
-
 Panama
-
 Papua New Guinea
-
 Paraguay
-
 Peru
Peru
-
 Philippines
-
 Poland
-
 Portugal
-
 Puerto Rico
-
 Qatar
Qatar
-
 Reunion
-
 Romania
-
 Rwanda
-
 Saudi Arabia
-
 Serbia
-
 Singapore
-
 Slovakia
-
 Slovenia
-
 Somalia
-
 South Africa
-
 Spain
Spain
-
 Sri Lanka
-
 Sweden
-
 Switzerland
-
 Syria
Syria
-
 Taiwan
-
 Tajikistan
-
 Tanzania
-
 Thailand
-
 Trinidad and Tobago
-
 Tunisia
-
 Turkey
-
 UAE
UAE
-
 Uganda
-
 Ukraine
-
 United Kingdom
-
United States
-
 Uruguay
-
 Uzbekistan
-
 Venezuela
-
 Vietnam
-
 Yemen
Yemen
-
 Zambia
-
 Zimbabwe
- Forex
- Crypto











