
What's behind Riot Platforms' latest stock surge?

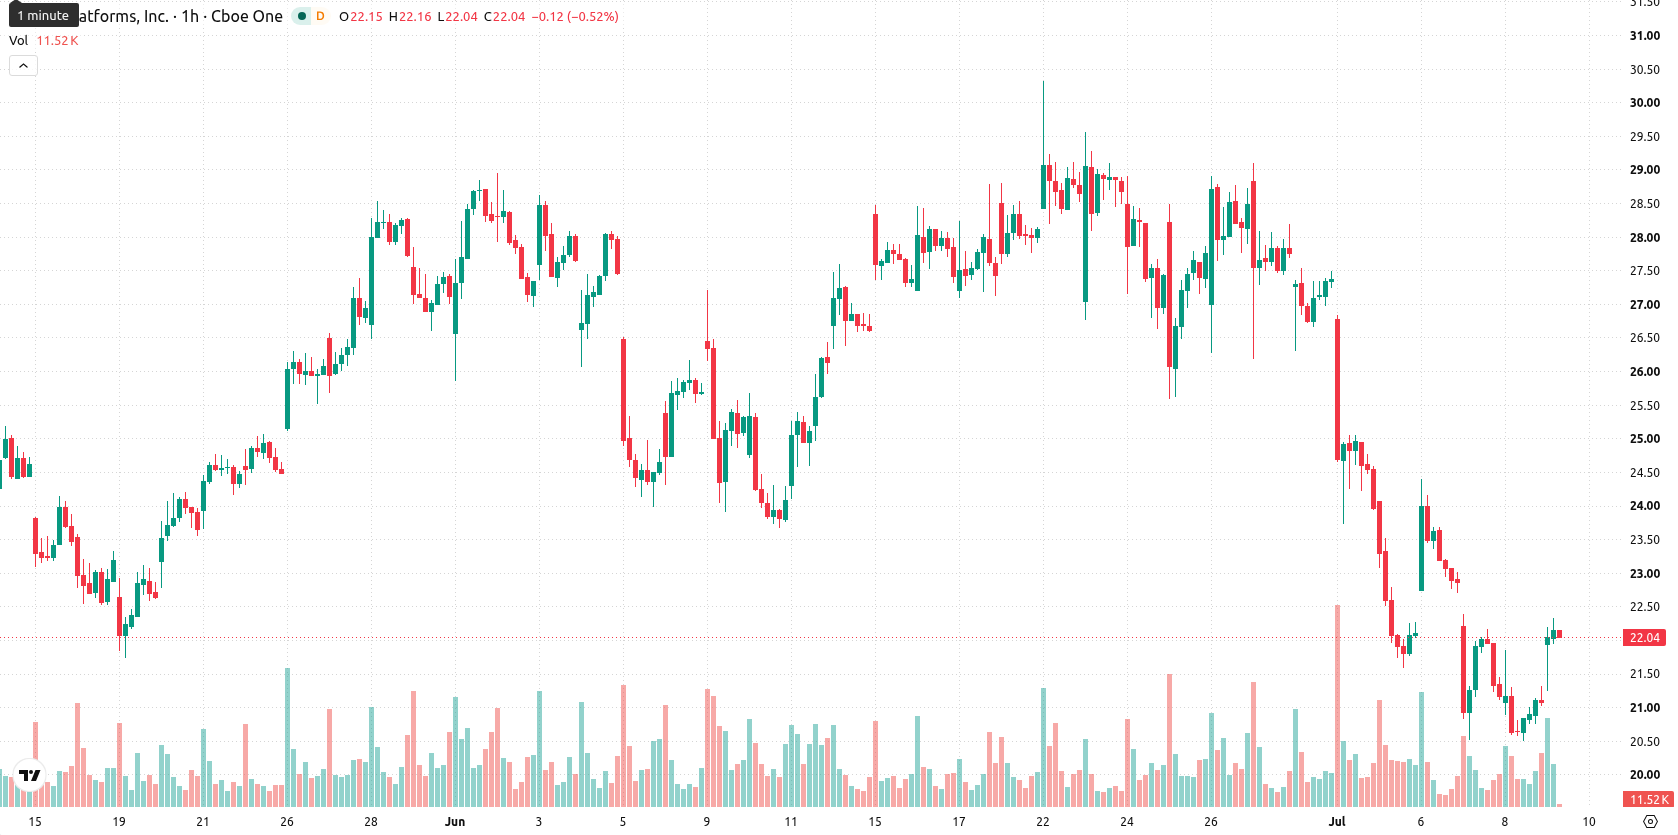
Riot Platforms (RIOT) stock is trading at $22.22, rising 5.36% on the day. The price sits above its short-term averages but remains beneath medium-term levels, with recent action showing a close near the daily high amid pronounced volatility.
 22.38
24.39
22.38
24.39
Highlights
- Riot Platforms faces reduced liquidity as 37% of its Bitcoin holdings are restricted or pledged, limiting asset mobilization.
- This limitation on digital asset access may heighten concerns over Riot’s short-term financial flexibility and overall risk exposure.
- Technically, RIOT trades in a volatile range of $20.48 to $23.96, with mixed momentum signals and downside risk prevailing near-term.
Operational flexibility limited as asset restrictions tighten risk outlook
According to Kucoin, approximately 37% of Riot Platforms' reported Bitcoin holdings are currently classified as restricted or pledged. This restriction could reduce the company’s ability to mobilize its digital assets for operational purposes, especially if market volatility increases and immediate liquidity is needed. Market participants may interpret this limited access to assets as a factor impacting Riot Platforms’ short-term financial flexibility and overall risk profile.
Mixed momentum signals emerge as resistance and sell pressure converge
On the hourly chart, RIOT is trading above the 20-period moving average but remains below the 50-period moving average, while the long-term 200-period average provides support beneath the current price. The Ichimoku Kijun level stands at $22.44 as immediate resistance. Among momentum indicators, the Moving Average Convergence Divergence (MACD) and Average Directional Index (ADX) both indicate sell pressure. The Relative Strength Index (RSI) is at 47.77 and signals a bearish bias, whereas Stochastic RSI points to overbought conditions. The Commodity Channel Index (CCI) is neutral, Bull/Bear Power signals buyer dominance, and the Awesome Oscillator shows a neutral stance. Divergences among these indicators highlight mixed momentum and suggest choppy intraday activity.
Downside risks grow as range-bound action follows volatility spike
In the short term, RIOT is expected to fluctuate between $20.48 and $23.96, consistent with typical volatility bands for the stock. The probability of further upside is estimated at 35%, implying a bias toward renewed downside pressure in the coming sessions. Key scenarios to monitor include consolidation within the established range, a breakout above $22.44 resistance in a bullish scenario, or a drop below $20.48 support on renewed selling. Traders should watch for a resolution of the current mixed momentum signals to clarify the next decisive move.
Earlier, analysts noted that Riot Platforms was under sustained bearish momentum with downside risks dominating the outlook. The latest price action and new information regarding restricted Bitcoin holdings introduce additional uncertainty, making it critical for traders to monitor the persistence of mixed momentum signals and potential volatility around the $22.44 resistance level.








-
 Afghanistan
-
 Albania
-
 Algeria
-
 Angola
-
 Argentina
-
 Armenia
-
 Australia
-
 Austria
-
 Azerbaijan
-
 Bahamas
-
 Bahrain
-
 Bangladesh
-
 Belarus
-
 Belgium
-
 Bolivia
-
 Botswana
-
 Brazil
-
 Brunei
-
 Bulgaria
-
 Cambodia
-
 Cameroon
-
 Canada
-
 Chile
Chile
-
 China
China
-
 Colombia
-
 Congo
Congo
-
 Costa Rica
-
 Cote d'Ivoire
-
 Croatia
-
 Cuba
Cuba
-
 Cyprus
-
 Czechia
-
 DR Congo
-
 Denmark
-
 Dominican Republic
-
 Ecuador
-
 Egypt
Egypt
-
 El Salvador
-
 Estonia
-
 Eswatini
-
 Ethiopia
-
 Finland
-
 France
-
 Georgia
-
 Germany
-
 Ghana
Ghana
-
 Greece
-
 Haiti
Haiti
-
 Hong Kong
-
 Hungary
-
 India
India
-
 Indonesia
-
 Iran, Islamic republic
-
 Iraq
Iraq
-
 Ireland
-
 Israel
-
 Italy
Italy
-
 Jamaica
-
 Japan
Japan
-
 Jordan
-
 Kazakhstan
-
 Kenya
Kenya
-
 Korea
Korea
-
 Kuwait
-
 Kyrgyzstan
-
 Laos
Laos
-
 Latvia
-
 Lebanon
-
 Lesotho
-
 Libya
Libya
-
 Lithuania
-
 Luxembourg
-
 Madagascar
-
 Malaysia
-
 Malta
Malta
-
 Mauritius
-
 Mexico
-
 Moldova
-
 Mongolia
-
 Montenegro
-
 Morocco
-
 Mozambique
-
 Myanmar
-
 Namibia
-
 Nepal
Nepal
-
 Netherlands
-
 New Zealand
-
 Nigeria
-
 North Macedonia
-
 Norway
-
 Oman
Oman
-
 Pakistan
-
 Palestine
-
 Panama
-
 Papua New Guinea
-
 Paraguay
-
 Peru
Peru
-
 Philippines
-
 Poland
-
 Portugal
-
 Puerto Rico
-
 Qatar
Qatar
-
 Reunion
-
 Romania
-
 Rwanda
-
 Saudi Arabia
-
 Serbia
-
 Singapore
-
 Slovakia
-
 Slovenia
-
 Somalia
-
 South Africa
-
 Spain
Spain
-
 Sri Lanka
-
 Sweden
-
 Switzerland
-
 Syria
Syria
-
 Taiwan
-
 Tajikistan
-
 Tanzania
-
 Thailand
-
 Trinidad and Tobago
-
 Tunisia
-
 Turkey
-
 UAE
UAE
-
 Uganda
-
 Ukraine
-
 United Kingdom
-
United States
-
 Uruguay
-
 Uzbekistan
-
 Venezuela
-
 Vietnam
-
 Yemen
Yemen
-
 Zambia
-
 Zimbabwe
- Forex
- Crypto











