
RIOT slides around 3.5% as unable to break above immediate resistance

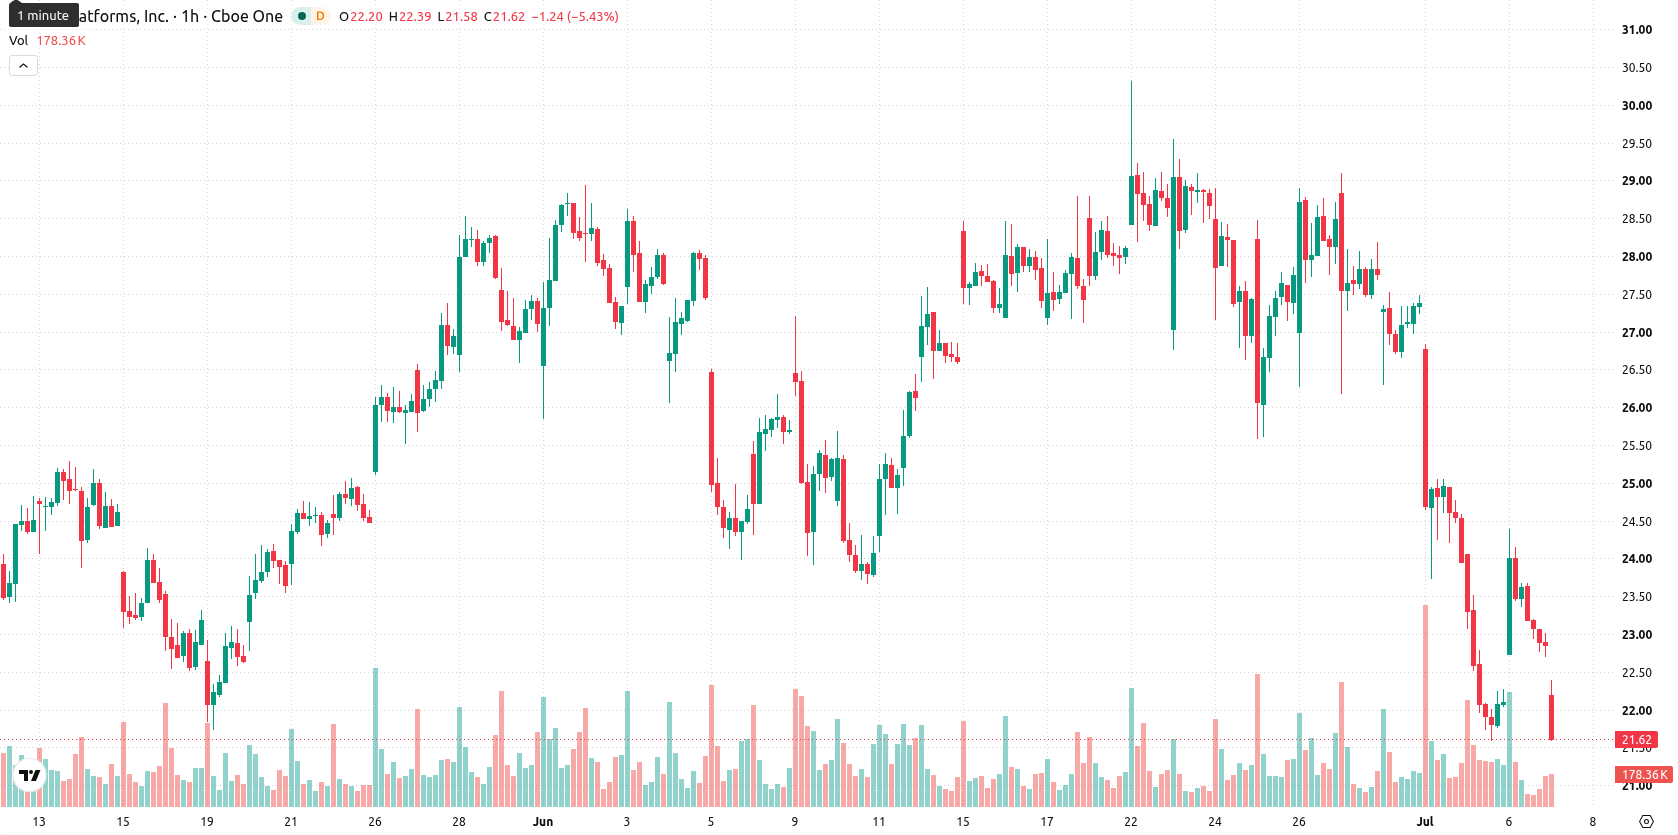
Riot Platforms (RIOT) stock is trading at $22.08, marking a daily decline of 3.48%. The price holds below its key moving averages, aligning with notable downward intraday pressure.
 21.83
24.39
21.83
24.39
Highlights
- RIOT/USD faces sustained bearish momentum, trading below short- and medium-term averages despite holding above long-term support.
- Momentum and trend indicators signal strong downside pressure, with pronounced seller dominance and minimal prospects for an immediate reversal.
- Expected trading range over the next 2–3 days is $19.72 to $24.44, with downside risk outweighing upside potential barring a breakout above $24.55.
Bearish momentum builds as RIOT tests oversold technicals
On the H1 timeframe, RIOT is trading below both the 20-period moving average at $23.21 and the 50-period moving average at $25.72, while staying above the 200-period moving average at $18.38 on the daily chart. The Ichimoku Kijun level, currently at $24.55, serves as immediate resistance. Technical indicators signal seller dominance—Momentum indicators show persistent downside: the Moving Average Convergence Divergence (MACD) and the Awesome Oscillator both indicate strong sell signals, while the Average Directional Index (ADX) also points to a bearish bias. With the Relative Strength Index (RSI) at 32.93 and the Commodity Channel Index (CCI) offering sell signals, the setup reflects oversold conditions; Bull/Bear Power confirms seller momentum. The Stochastic RSI reads neutral, indicating no imminent reversal.
Downside risk intensifies as support at $19.72 faces pressure
Over the next two to three trading days, RIOT is expected to trade within a volatility band of $19.72 to $24.44, reflecting typical fluctuations around current levels. The probability of a downside break is high, while the chance of a significant upward move remains low. A sustained bullish scenario would require a break above immediate resistance at $24.55, whereas a bearish outcome is likely if support near $19.72 does not hold.
Earlier, analysts noted that Riot Platforms’ outlook was constrained by persistent bearish momentum, with technical signals weighted toward downside risk despite some improvement in liquidity. The latest data reinforce the dominance of sellers and heightened bearish pressure, making the sustainability of support near $19.72 crucial for traders monitoring potential downside acceleration.













-
 Afghanistan
-
 Albania
-
 Algeria
-
 Angola
-
 Argentina
-
 Armenia
-
 Australia
-
 Austria
-
 Azerbaijan
-
 Bahamas
-
 Bahrain
-
 Bangladesh
-
 Belarus
-
 Belgium
-
 Bolivia
-
 Botswana
-
 Brazil
-
 Brunei
-
 Bulgaria
-
 Cambodia
-
 Cameroon
-
 Canada
-
 Chile
Chile
-
 China
China
-
 Colombia
-
 Congo
Congo
-
 Costa Rica
-
 Cote d'Ivoire
-
 Croatia
-
 Cuba
Cuba
-
 Cyprus
-
 Czechia
-
 DR Congo
-
 Denmark
-
 Dominican Republic
-
 Ecuador
-
 Egypt
Egypt
-
 El Salvador
-
 Estonia
-
 Eswatini
-
 Ethiopia
-
 Finland
-
 France
-
 Georgia
-
 Germany
-
 Ghana
Ghana
-
 Greece
-
 Haiti
Haiti
-
 Hong Kong
-
 Hungary
-
 India
India
-
 Indonesia
-
 Iran, Islamic republic
-
 Iraq
Iraq
-
 Ireland
-
 Israel
-
 Italy
Italy
-
 Jamaica
-
 Japan
Japan
-
 Jordan
-
 Kazakhstan
-
 Kenya
Kenya
-
 Korea
Korea
-
 Kuwait
-
 Kyrgyzstan
-
 Laos
Laos
-
 Latvia
-
 Lebanon
-
 Lesotho
-
 Libya
Libya
-
 Lithuania
-
 Luxembourg
-
 Madagascar
-
 Malaysia
-
 Malta
Malta
-
 Mauritius
-
 Mexico
-
 Moldova
-
 Mongolia
-
 Montenegro
-
 Morocco
-
 Mozambique
-
 Myanmar
-
 Namibia
-
 Nepal
Nepal
-
 Netherlands
-
 New Zealand
-
 Nigeria
-
 North Macedonia
-
 Norway
-
 Oman
Oman
-
 Pakistan
-
 Palestine
-
 Panama
-
 Papua New Guinea
-
 Paraguay
-
 Peru
Peru
-
 Philippines
-
 Poland
-
 Portugal
-
 Puerto Rico
-
 Qatar
Qatar
-
 Reunion
-
 Romania
-
 Rwanda
-
 Saudi Arabia
-
 Serbia
-
 Singapore
-
 Slovakia
-
 Slovenia
-
 Somalia
-
 South Africa
-
 Spain
Spain
-
 Sri Lanka
-
 Sweden
-
 Switzerland
-
 Syria
Syria
-
 Taiwan
-
 Tajikistan
-
 Tanzania
-
 Thailand
-
 Trinidad and Tobago
-
 Tunisia
-
 Turkey
-
 UAE
UAE
-
 Uganda
-
 Ukraine
-
 United Kingdom
-
United States
-
 Uruguay
-
 Uzbekistan
-
 Venezuela
-
 Vietnam
-
 Yemen
Yemen
-
 Zambia
-
 Zimbabwe
- Forex
- Crypto











