
GOOGL shares slide to lower end of recent range as price holds above MA-20: weekly outlook

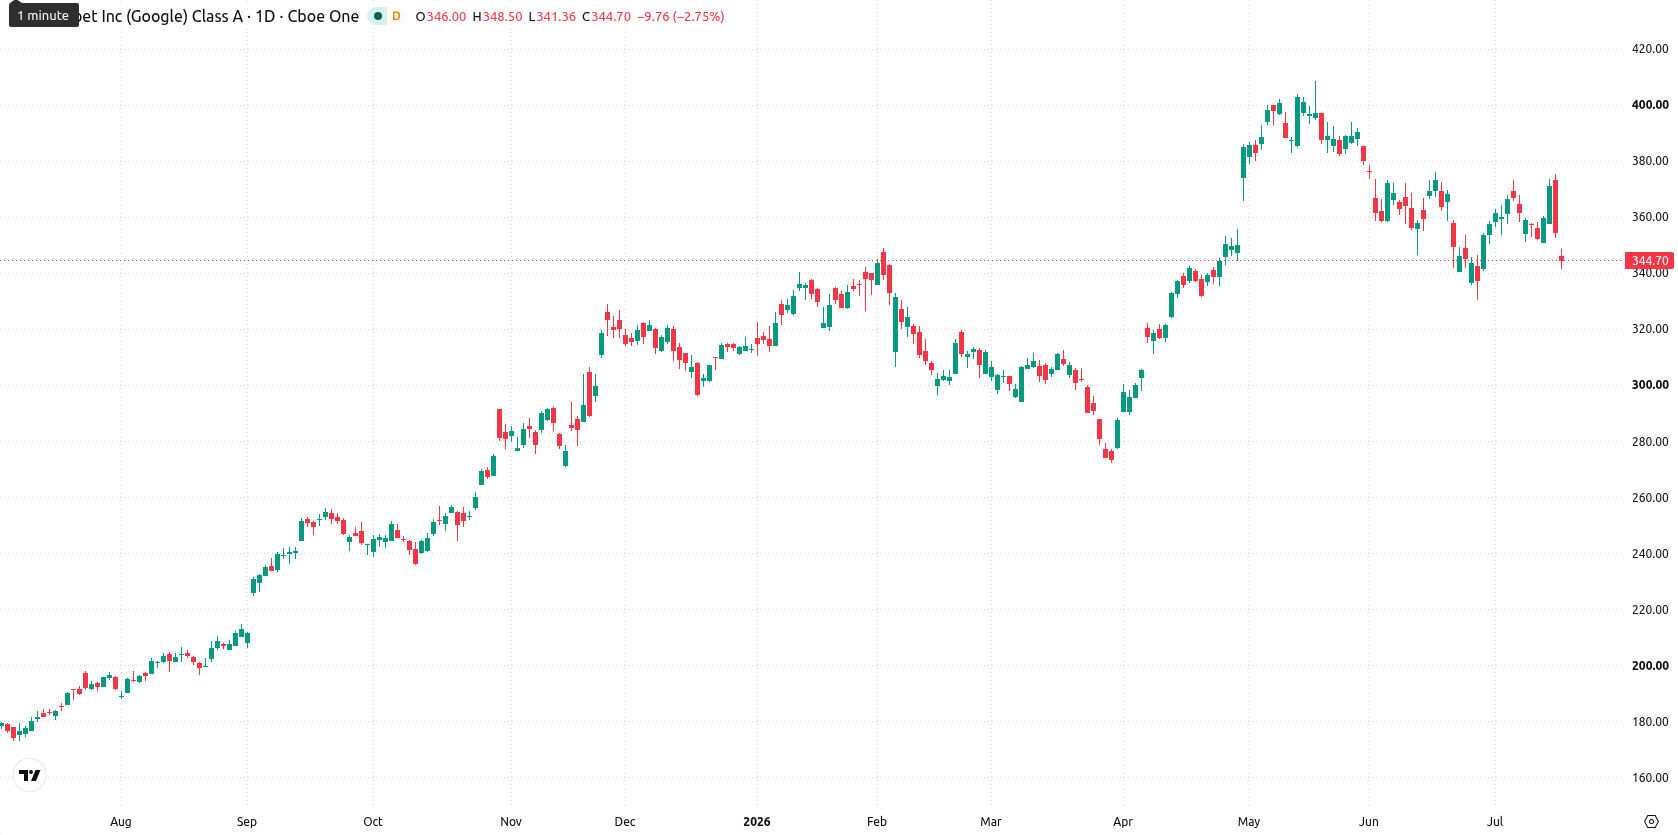
Alphabet Inc. (GOOGL) is currently trading at $346.96, just above its weekly MA-20 at $346.28, well above the MA-50 at $306.49, and significantly higher than the MA-200 at $184.45. Over the past week, GOOGL declined by $10.27, or 3.05%, closing at the lower boundary of its weekly trading range while maintaining a strong bullish structure above key moving averages.
 348.38
375.27
348.38
375.27
Highlights
- GOOGL trades in a bullish structure above major moving averages, with immediate dynamic support at current levels.
- Technical momentum remains constructive, with three of four key weekly indicators signaling buy strength despite recent pullback.
- GOOGL is expected to consolidate between $360.11 and $371.56 this week, with a 75% probability of upward movement.
Regulatory scrutiny and AI concerns weigh as earnings approach this week
Alphabet is preparing to report its second-quarter earnings on July 22, drawing investor focus to advertising performance, cloud business results, and heavy investment in artificial intelligence infrastructure. The company continues to face heightened regulatory scrutiny from the European Union, including new requirements to open Android and search data to competitors and additional fines for non-compliance. Additionally, concerns were raised after reports of a delay in the launch of the Gemini 3.5 Pro AI model.
Buyer momentum persists amid mixed technical signals over the week
Weekly technicals for GOOGL remain constructive: the MACD on W1 signals Strong Buy, with an ADX reading of 28.08 indicating a healthy trend. RSI W1 is in buy territory at 55.50, while Stochastic RSI shows a clear oversold condition at 18.65. CCI is neutral, and Bull/Bear Power remains in overbought territory with a positive value, reflecting continued buyer momentum. The price is supported by the MA-20 and is trading well above the MA-50 and MA-200, establishing a bullish medium- and long-term structure, though it currently sits at the bottom of its weekly range.
Consolidation likely as breakout risk hinges on weekly momentum
For the next 5 trading days, GOOGL is expected to trade between $360.11 and $371.56 based on weekly momentum indicators and recent volatility. There is a 75% probability of an upward move as indicated by the majority of strong weekly momentum signals, with a 25% chance of further decline. Baseline scenario is a consolidation above key support within this corridor. A bullish breakout above $371.56 could target higher resistance, while a fall below $360.11 would introduce further risk toward secondary support.
Earlier, analysts noted that Alphabet's near-term outlook was supported by ongoing investor optimism around AI integration and resilient business fundamentals. The current technical setup, coupled with continued regulatory headlines and AI developments, underscores the importance of monitoring the $371.56 level for a potential bullish breakout in the coming sessions.









-
 Afghanistan
-
 Albania
-
 Algeria
-
 Angola
-
 Argentina
-
 Armenia
-
 Australia
-
 Austria
-
 Azerbaijan
-
 Bahamas
-
 Bahrain
-
 Bangladesh
-
 Belarus
-
 Belgium
-
 Bolivia
-
 Botswana
-
 Brazil
-
 Brunei
-
 Bulgaria
-
 Cambodia
-
 Cameroon
-
 Canada
-
 Chile
Chile
-
 China
China
-
 Colombia
-
 Congo
Congo
-
 Costa Rica
-
 Cote d'Ivoire
-
 Croatia
-
 Cuba
Cuba
-
 Cyprus
-
 Czechia
-
 DR Congo
-
 Denmark
-
 Dominican Republic
-
 Ecuador
-
 Egypt
Egypt
-
 El Salvador
-
 Estonia
-
 Eswatini
-
 Ethiopia
-
 Finland
-
 France
-
 Georgia
-
 Germany
-
 Ghana
Ghana
-
 Greece
-
 Haiti
Haiti
-
 Hong Kong
-
 Hungary
-
 India
India
-
 Indonesia
-
 Iran, Islamic republic
-
 Iraq
Iraq
-
 Ireland
-
 Israel
-
 Italy
Italy
-
 Jamaica
-
 Japan
Japan
-
 Jordan
-
 Kazakhstan
-
 Kenya
Kenya
-
 Korea
Korea
-
 Kuwait
-
 Kyrgyzstan
-
 Laos
Laos
-
 Latvia
-
 Lebanon
-
 Lesotho
-
 Libya
Libya
-
 Lithuania
-
 Luxembourg
-
 Madagascar
-
 Malaysia
-
 Malta
Malta
-
 Mauritius
-
 Mexico
-
 Moldova
-
 Mongolia
-
 Montenegro
-
 Morocco
-
 Mozambique
-
 Myanmar
-
 Namibia
-
 Nepal
Nepal
-
 Netherlands
-
 New Zealand
-
 Nigeria
-
 North Macedonia
-
 Norway
-
 Oman
Oman
-
 Pakistan
-
 Palestine
-
 Panama
-
 Papua New Guinea
-
 Paraguay
-
 Peru
Peru
-
 Philippines
-
 Poland
-
 Portugal
-
 Puerto Rico
-
 Qatar
Qatar
-
 Reunion
-
 Romania
-
 Rwanda
-
 Saudi Arabia
-
 Serbia
-
 Singapore
-
 Slovakia
-
 Slovenia
-
 Somalia
-
 South Africa
-
 Spain
Spain
-
 Sri Lanka
-
 Sweden
-
 Switzerland
-
 Syria
Syria
-
 Taiwan
-
 Tajikistan
-
 Tanzania
-
 Thailand
-
 Trinidad and Tobago
-
 Tunisia
-
 Turkey
-
 UAE
UAE
-
 Uganda
-
 Ukraine
-
 United Kingdom
-
United States
-
 Uruguay
-
 Uzbekistan
-
 Venezuela
-
 Vietnam
-
 Yemen
Yemen
-
 Zambia
-
 Zimbabwe
- Forex
- Crypto











