
Upcoming Q2 2026 earnings announcement. Can TSLA hold support or avoid deeper losses?

Tesla (TSLA) stock is trading at $381.06, marking a daily decline of 2.35% as it remains below its key short- and long-term moving averages.
 385.64
406.59
385.64
406.59
Highlights
- Tesla's Q2 2026 earnings release on July 22 drives heightened investor caution amid operational uncertainty.
- The NTSB cleared Full Self Driving of fault in a Texas crash, temporarily easing regulatory risk but not improving sentiment.
- TSLA trades below key moving averages with strong seller pressure, high downside probability, and a $371.74–$391.93 range expected short term.
Investor caution rises with Q2 earnings and FSD updates
Tesla is approaching the scheduled release of its second quarter 2026 financial results on July 22, 2026, an event creating heightened uncertainty and cautious positioning as investors await details on operational performance and strategy, according to Investopedia. The National Transportation Safety Board cleared Tesla's Full Self Driving system of responsibility in a recent Texas crash, a finding reported by Tipranks that moderates immediate regulatory risk but does not fully resolve broader sentiment concerns. Additional incremental improvement came with the July 13, 2026 rollout of Full Self Driving v14.3.5, featuring a new Camera Preview function as reported by Teslaoracle, though price action has remained under broader selling pressure.
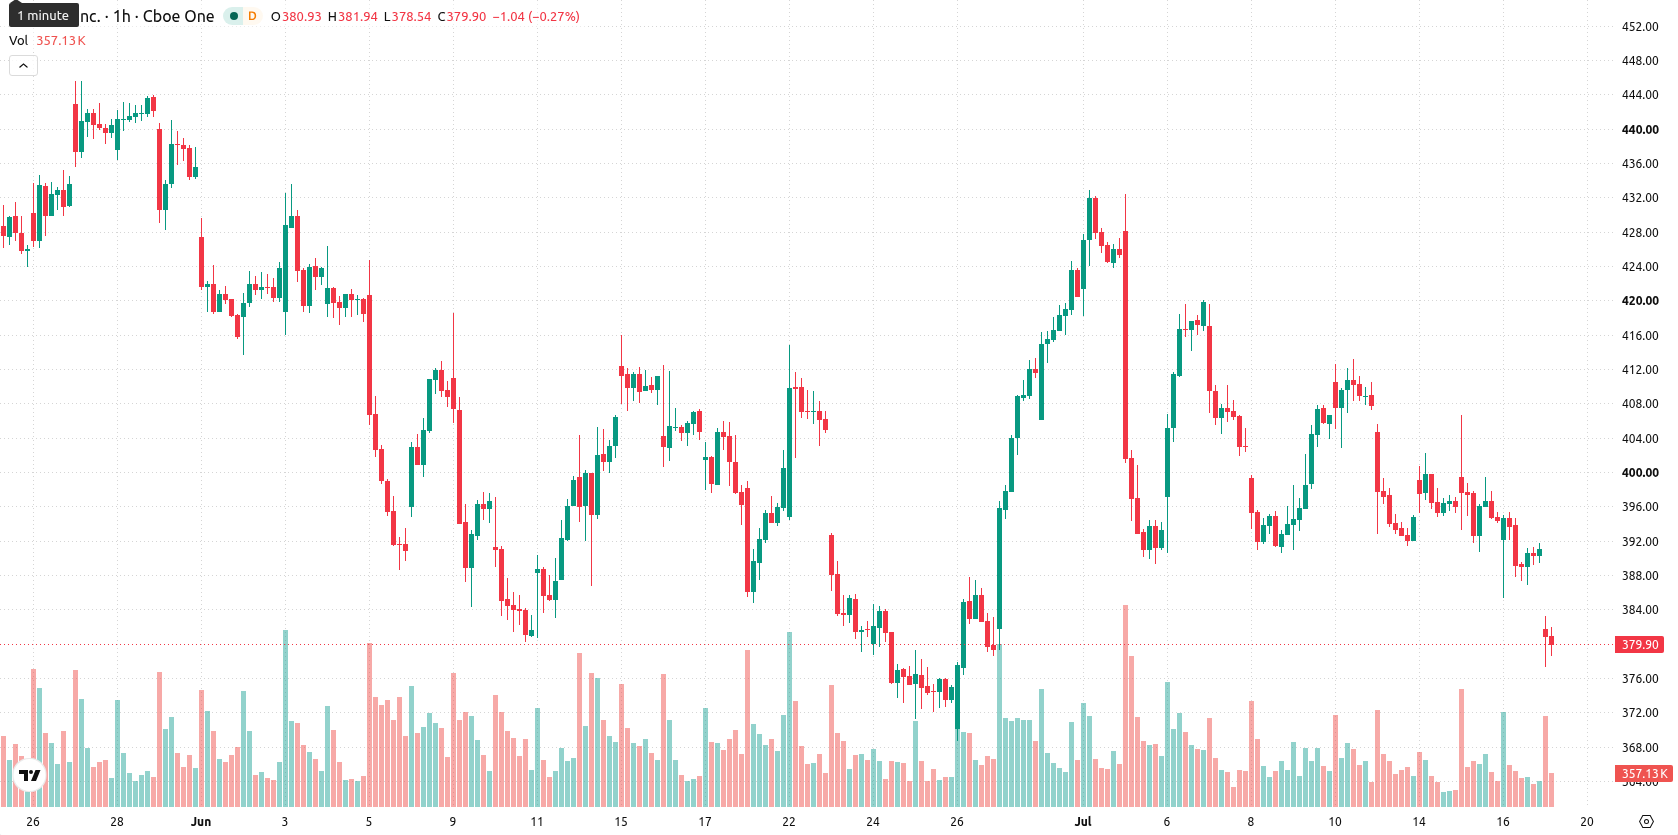
Downside momentum dominates as technical signals confirm weakness
On the H1 timeframe, TSLA is trading below the 20-period and 50-period moving averages, with the price also well beneath the 200-period moving average on the daily chart. The Ichimoku Kijun line is positioned at $395.96, representing immediate resistance. Momentum readings are broadly negative: the Moving Average Convergence Divergence (MACD) shows persistent selling signals, while the Average Directional Index (ADX) is neutral. The Relative Strength Index (RSI), Stochastic RSI, and Commodity Channel Index (CCI) all indicate oversold or sell conditions, and Bull/Bear Power confirms that sellers are dominating intraday momentum. The Awesome Oscillator is currently neutral, and volatility remains low as the price holds near its session low.
Downtrend risk persists as volatility band contains price
Over the next two to three sessions, TSLA is expected to fluctuate within a volatility band from $371.74 to $391.93. The probability of a continued move lower remains very high, while bullish reversal risk is considered very low. The most likely scenario is a sideways movement within this range unless the price breaks above the immediate resistance at $395.96, which would be needed to signal a bullish shift. A decisive drop below the $371.74 support could trigger further downside beyond the current range.
Earlier, analysts noted that Tesla's near-term stock direction would likely hinge on upcoming earnings and ongoing regulatory developments related to its Full Self Driving system. With current momentum signaling persistent selling pressure and volatility compressed near session lows, traders should closely monitor for a decisive move outside the $371.74–$391.93 band as an indicator of the next directional shift.









-
 Afghanistan
-
 Albania
-
 Algeria
-
 Angola
-
 Argentina
-
 Armenia
-
 Australia
-
 Austria
-
 Azerbaijan
-
 Bahamas
-
 Bahrain
-
 Bangladesh
-
 Belarus
-
 Belgium
-
 Bolivia
-
 Botswana
-
 Brazil
-
 Brunei
-
 Bulgaria
-
 Cambodia
-
 Cameroon
-
 Canada
-
 Chile
Chile
-
 China
China
-
 Colombia
-
 Congo
Congo
-
 Costa Rica
-
 Cote d'Ivoire
-
 Croatia
-
 Cuba
Cuba
-
 Cyprus
-
 Czechia
-
 DR Congo
-
 Denmark
-
 Dominican Republic
-
 Ecuador
-
 Egypt
Egypt
-
 El Salvador
-
 Estonia
-
 Eswatini
-
 Ethiopia
-
 Finland
-
 France
-
 Georgia
-
 Germany
-
 Ghana
Ghana
-
 Greece
-
 Haiti
Haiti
-
 Hong Kong
-
 Hungary
-
 India
India
-
 Indonesia
-
 Iran, Islamic republic
-
 Iraq
Iraq
-
 Ireland
-
 Israel
-
 Italy
Italy
-
 Jamaica
-
 Japan
Japan
-
 Jordan
-
 Kazakhstan
-
 Kenya
Kenya
-
 Korea
Korea
-
 Kuwait
-
 Kyrgyzstan
-
 Laos
Laos
-
 Latvia
-
 Lebanon
-
 Lesotho
-
 Libya
Libya
-
 Lithuania
-
 Luxembourg
-
 Madagascar
-
 Malaysia
-
 Malta
Malta
-
 Mauritius
-
 Mexico
-
 Moldova
-
 Mongolia
-
 Montenegro
-
 Morocco
-
 Mozambique
-
 Myanmar
-
 Namibia
-
 Nepal
Nepal
-
 Netherlands
-
 New Zealand
-
 Nigeria
-
 North Macedonia
-
 Norway
-
 Oman
Oman
-
 Pakistan
-
 Palestine
-
 Panama
-
 Papua New Guinea
-
 Paraguay
-
 Peru
Peru
-
 Philippines
-
 Poland
-
 Portugal
-
 Puerto Rico
-
 Qatar
Qatar
-
 Reunion
-
 Romania
-
 Rwanda
-
 Saudi Arabia
-
 Serbia
-
 Singapore
-
 Slovakia
-
 Slovenia
-
 Somalia
-
 South Africa
-
 Spain
Spain
-
 Sri Lanka
-
 Sweden
-
 Switzerland
-
 Syria
Syria
-
 Taiwan
-
 Tajikistan
-
 Tanzania
-
 Thailand
-
 Trinidad and Tobago
-
 Tunisia
-
 Turkey
-
 UAE
UAE
-
 Uganda
-
 Ukraine
-
 United Kingdom
-
United States
-
 Uruguay
-
 Uzbekistan
-
 Venezuela
-
 Vietnam
-
 Yemen
Yemen
-
 Zambia
-
 Zimbabwe
- Forex
- Crypto











