
Upcoming Q2 2026 earnings report looms. Can AMD stock avoid deeper losses?

Apple Inc. (AMD) stock is trading at $491.14 after a daily drop of 1.87%. The price is currently below its key moving averages, which points to ongoing short-term weakness.
 505.56
574.20
505.56
574.20
Highlights
- AMD's Q2 2026 earnings report is set for August 4, focusing investor attention and heightening near-term volatility expectations.
- Share price action remains under broader selling pressure ahead of the results, with market sentiment cautious about future guidance.
- Technicals signal dominant downside risk, with consolidation likely in the $454.29 to $527.99 range and a low probability of an upward reversal.
Investor focus and volatility rise as earnings loom
AMD is scheduled to report its second-quarter 2026 earnings on August 4, according to Finance Yahoo. The impending release has raised investor attention and increased the potential for price volatility, as market participants anticipate implications for future performance. This upcoming event is currently shaping sentiment and trading activity, though price action has remained under broader selling pressure.
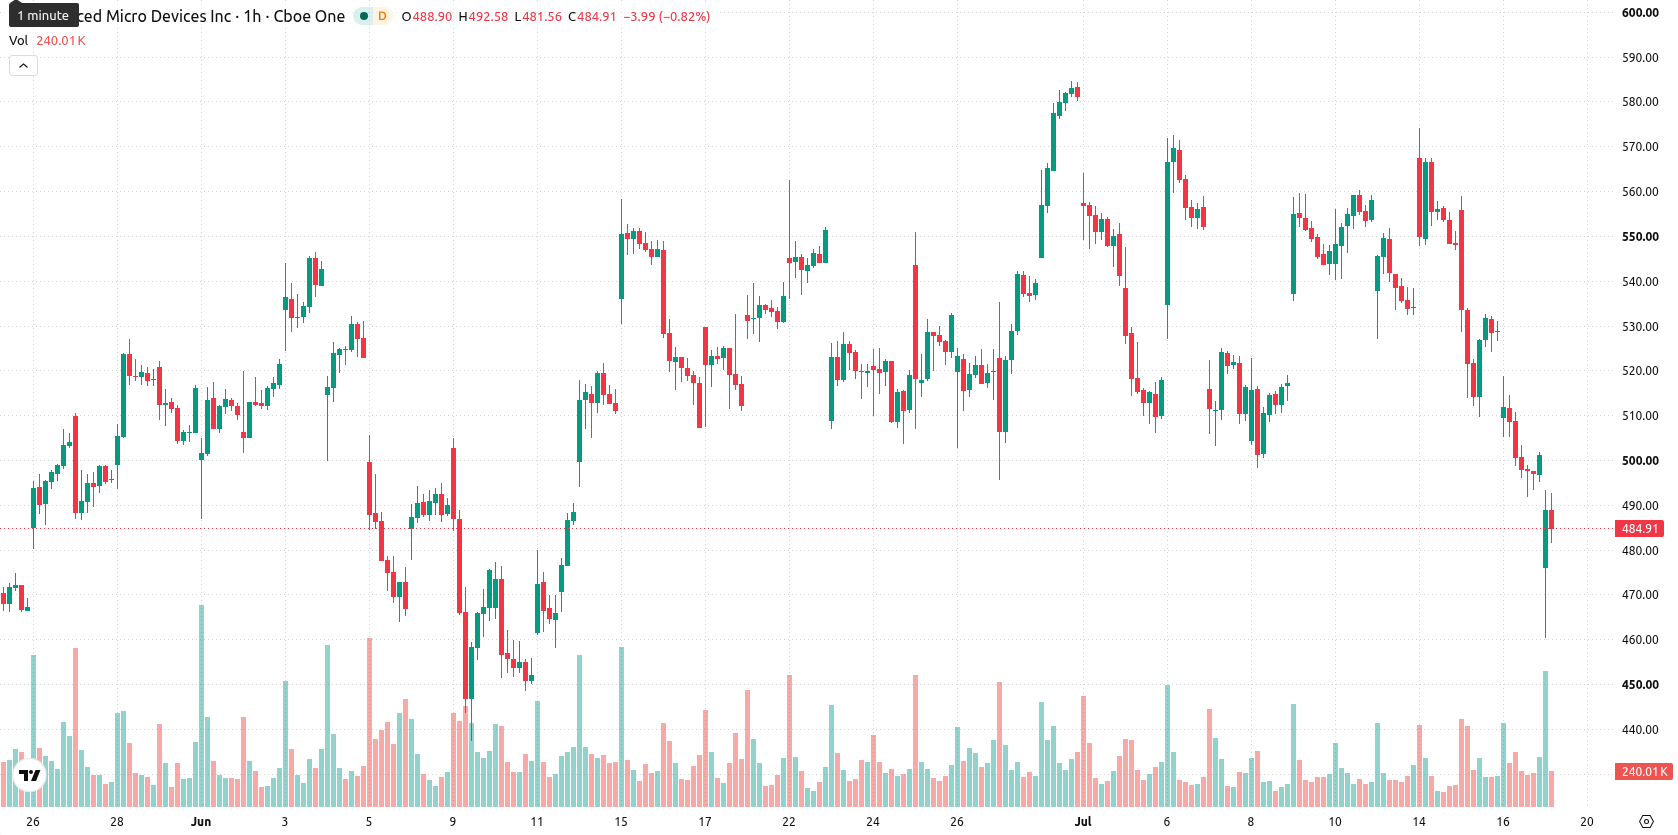
Short-term bearish momentum as price tests resistance
Technically, AMD is trading below its MA-20 at $523.13 and MA-50 at $533.48 on the hourly chart, while remaining well above its long-term MA-200 at $294. Price faces immediate resistance at the Ichimoku Kijun level of $533. Intraday momentum indicators are negative, with Relative Strength Index (RSI) at 34.14 and Commodity Channel Index (CCI) both signaling a Sell, and Moving Average Convergence Divergence (MACD) confirming selling pressure. The Average Directional Index (ADX) and Stochastic RSI are neutral, indicating a pause in trend strength. Bull/Bear Power is deeply negative, while the Awesome Oscillator continues to support the downward move.
Limited upside as downside risk dominates near-term outlook
Looking ahead 2–3 trading days, AMD is likely to consolidate within a band of $454.29 to $527.99, reflecting typical volatility for the current backdrop. Statistically, the probability of an upward breakout is low, while the likelihood of continued downside movement remains high. A bullish scenario would be triggered only by a strong move above resistance at $533, while a drop below $454.29 would open up a deeper bearish path.
Earlier, analysts noted that AMD was under sustained selling pressure as profit-taking and investor caution dominated the semiconductor sector. The current environment of weakening momentum ahead of earnings adds weight to this bearish outlook, making a decisive move below $454.29 the key downside risk for traders to monitor in the near term.


Latest AMD News






-
 Afghanistan
-
 Albania
-
 Algeria
-
 Angola
-
 Argentina
-
 Armenia
-
 Australia
-
 Austria
-
 Azerbaijan
-
 Bahamas
-
 Bahrain
-
 Bangladesh
-
 Belarus
-
 Belgium
-
 Bolivia
-
 Botswana
-
 Brazil
-
 Brunei
-
 Bulgaria
-
 Cambodia
-
 Cameroon
-
 Canada
-
 Chile
Chile
-
 China
China
-
 Colombia
-
 Congo
Congo
-
 Costa Rica
-
 Cote d'Ivoire
-
 Croatia
-
 Cuba
Cuba
-
 Cyprus
-
 Czechia
-
 DR Congo
-
 Denmark
-
 Dominican Republic
-
 Ecuador
-
 Egypt
Egypt
-
 El Salvador
-
 Estonia
-
 Eswatini
-
 Ethiopia
-
 Finland
-
 France
-
 Georgia
-
 Germany
-
 Ghana
Ghana
-
 Greece
-
 Haiti
Haiti
-
 Hong Kong
-
 Hungary
-
 India
India
-
 Indonesia
-
 Iran, Islamic republic
-
 Iraq
Iraq
-
 Ireland
-
 Israel
-
 Italy
Italy
-
 Jamaica
-
 Japan
Japan
-
 Jordan
-
 Kazakhstan
-
 Kenya
Kenya
-
 Korea
Korea
-
 Kuwait
-
 Kyrgyzstan
-
 Laos
Laos
-
 Latvia
-
 Lebanon
-
 Lesotho
-
 Libya
Libya
-
 Lithuania
-
 Luxembourg
-
 Madagascar
-
 Malaysia
-
 Malta
Malta
-
 Mauritius
-
 Mexico
-
 Moldova
-
 Mongolia
-
 Montenegro
-
 Morocco
-
 Mozambique
-
 Myanmar
-
 Namibia
-
 Nepal
Nepal
-
 Netherlands
-
 New Zealand
-
 Nigeria
-
 North Macedonia
-
 Norway
-
 Oman
Oman
-
 Pakistan
-
 Palestine
-
 Panama
-
 Papua New Guinea
-
 Paraguay
-
 Peru
Peru
-
 Philippines
-
 Poland
-
 Portugal
-
 Puerto Rico
-
 Qatar
Qatar
-
 Reunion
-
 Romania
-
 Rwanda
-
 Saudi Arabia
-
 Serbia
-
 Singapore
-
 Slovakia
-
 Slovenia
-
 Somalia
-
 South Africa
-
 Spain
Spain
-
 Sri Lanka
-
 Sweden
-
 Switzerland
-
 Syria
Syria
-
 Taiwan
-
 Tajikistan
-
 Tanzania
-
 Thailand
-
 Trinidad and Tobago
-
 Tunisia
-
 Turkey
-
 UAE
UAE
-
 Uganda
-
 Ukraine
-
 United Kingdom
-
United States
-
 Uruguay
-
 Uzbekistan
-
 Venezuela
-
 Vietnam
-
 Yemen
Yemen
-
 Zambia
-
 Zimbabwe
- Forex
- Crypto











