
Will JetBlue stock hold support as Daytona Beach and Vero Beach routes are discontinued?

JetBlue (JBLU) stock is trading at $5.45, down 3.42% for the day. The price is currently below its short- and medium-term moving averages while remaining above its long-term average, reflecting pressure in the near term.
 5.58
5.76
5.58
5.76
Highlights
- JetBlue will exit Daytona Beach and discontinue Vero Beach–New York JFK routes by September 2026 due to sustained weak demand and underperformance.
- The airline is introducing flexible payment options with ClarityPay to drive more direct bookings and target cost-sensitive travelers.
- JBLU trades under intraday bearish pressure, ranging between $5.23 and $5.67, with technical signals skewed strongly negative.
Route withdrawals and flexible payments as JetBlue targets lagging demand
JetBlue's decision to end its service at Daytona Beach International Airport, with operations scheduled to cease after September 9, 2026, reflects a strategic response to lower-than-expected demand and weakening financial returns on the route, according to Wesh. This move highlights the airline's ongoing network rationalization, as it is also discontinuing Vero Beach to New York JFK flights after the same date due to consistently low passenger loads, as reported by Wptv. Complementing these operational adjustments, JetBlue has introduced flexible payment options through a partnership with ClarityPay to encourage direct bookings and address customer price sensitivity, according to Traveldailynews. In addition, the airline managed an isolated flight diversion from New York JFK to Fort Lauderdale on July 13, 2026, as covered by Nomadlawyer, though such events carry limited immediate operational impact.
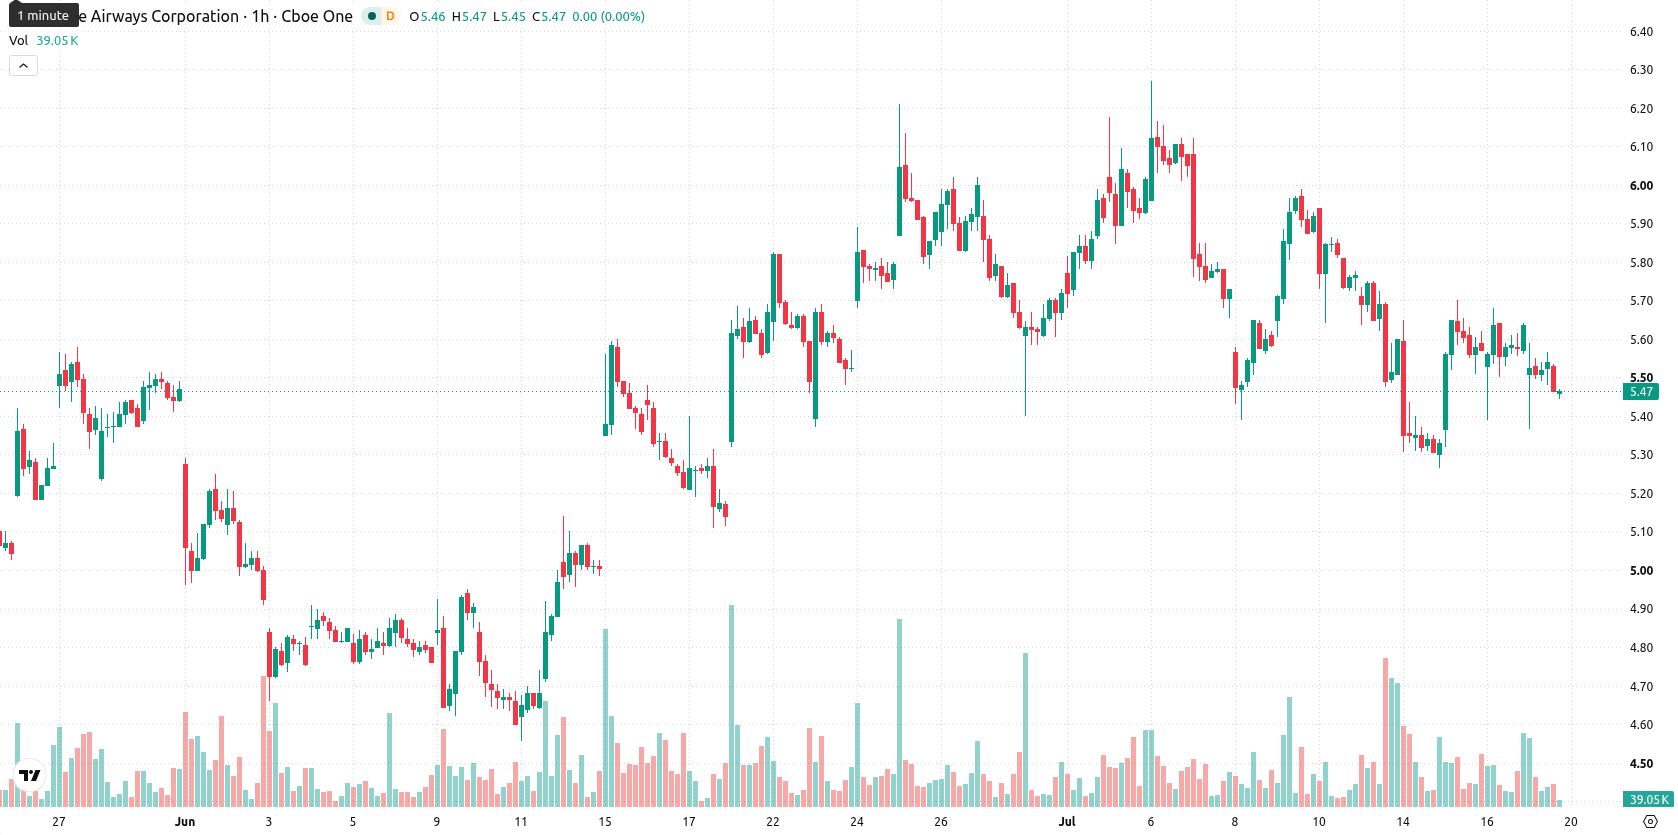
Seller momentum dominates as intraday signals diverge at resistance
On the H1 chart, JBLU is trading below both the 20-period ($5.56) and 50-period ($5.62) moving averages, while remaining above the 200-period moving average ($4.95) on the daily timeframe. The Ichimoku Kijun line stands at $5.48 and acts as an immediate resistance level. Momentum indicators provide a bearish picture: the Moving Average Convergence Divergence (MACD), Average Directional Index (ADX), and Bull/Bear Power are all in Sell mode, pointing to dominance by sellers intraday. The Relative Strength Index (RSI) registers at 45.71, aligning with a Sell stance, and the Stochastic RSI has entered oversold territory; the Commodity Channel Index (CCI) is neutral. The Awesome Oscillator further confirms downside momentum, though signal divergence appears as the oversold Stochastic RSI and neutral CCI contrast with the overall negative technical configuration.
Sideways pattern likely as volatility bands constrain further moves
Over the next two to three trading days, JBLU is expected to trade within a volatility band of $5.23 to $5.67. The probability of a downward move remains high, while upward movement is considered much less likely in the current environment. The baseline scenario sees the stock ranging sideways within this corridor, barring a significant break above immediate resistance at $5.48 or a drop below the $5.23 support level, which would open the way for further directional moves.
Earlier, analysts noted that JetBlue's near-term trajectory was defined by mixed technical signals and pending catalysts from operational expansion. The current environment introduces heightened downside risk amid route reductions and bearish momentum, making it important for investors to monitor the $5.23 support level for signs of further weakness.







-
 Afghanistan
-
 Albania
-
 Algeria
-
 Angola
-
 Argentina
-
 Armenia
-
 Australia
-
 Austria
-
 Azerbaijan
-
 Bahamas
-
 Bahrain
-
 Bangladesh
-
 Belarus
-
 Belgium
-
 Bolivia
-
 Botswana
-
 Brazil
-
 Brunei
-
 Bulgaria
-
 Cambodia
-
 Cameroon
-
 Canada
-
 Chile
Chile
-
 China
China
-
 Colombia
-
 Congo
Congo
-
 Costa Rica
-
 Cote d'Ivoire
-
 Croatia
-
 Cuba
Cuba
-
 Cyprus
-
 Czechia
-
 DR Congo
-
 Denmark
-
 Dominican Republic
-
 Ecuador
-
 Egypt
Egypt
-
 El Salvador
-
 Estonia
-
 Eswatini
-
 Ethiopia
-
 Finland
-
 France
-
 Georgia
-
 Germany
-
 Ghana
Ghana
-
 Greece
-
 Haiti
Haiti
-
 Hong Kong
-
 Hungary
-
 India
India
-
 Indonesia
-
 Iran, Islamic republic
-
 Iraq
Iraq
-
 Ireland
-
 Israel
-
 Italy
Italy
-
 Jamaica
-
 Japan
Japan
-
 Jordan
-
 Kazakhstan
-
 Kenya
Kenya
-
 Korea
Korea
-
 Kuwait
-
 Kyrgyzstan
-
 Laos
Laos
-
 Latvia
-
 Lebanon
-
 Lesotho
-
 Libya
Libya
-
 Lithuania
-
 Luxembourg
-
 Madagascar
-
 Malaysia
-
 Malta
Malta
-
 Mauritius
-
 Mexico
-
 Moldova
-
 Mongolia
-
 Montenegro
-
 Morocco
-
 Mozambique
-
 Myanmar
-
 Namibia
-
 Nepal
Nepal
-
 Netherlands
-
 New Zealand
-
 Nigeria
-
 North Macedonia
-
 Norway
-
 Oman
Oman
-
 Pakistan
-
 Palestine
-
 Panama
-
 Papua New Guinea
-
 Paraguay
-
 Peru
Peru
-
 Philippines
-
 Poland
-
 Portugal
-
 Puerto Rico
-
 Qatar
Qatar
-
 Reunion
-
 Romania
-
 Rwanda
-
 Saudi Arabia
-
 Serbia
-
 Singapore
-
 Slovakia
-
 Slovenia
-
 Somalia
-
 South Africa
-
 Spain
Spain
-
 Sri Lanka
-
 Sweden
-
 Switzerland
-
 Syria
Syria
-
 Taiwan
-
 Tajikistan
-
 Tanzania
-
 Thailand
-
 Trinidad and Tobago
-
 Tunisia
-
 Turkey
-
 UAE
UAE
-
 Uganda
-
 Ukraine
-
 United Kingdom
-
United States
-
 Uruguay
-
 Uzbekistan
-
 Venezuela
-
 Vietnam
-
 Yemen
Yemen
-
 Zambia
-
 Zimbabwe
- Forex
- Crypto











