
Microsoft falls to $493 as stock breaks long-term support and tests 200-day EMA

Microsoft closed near $493 on Tuesday after a sustained slide that pushed the stock below a major support structure for the first time since April. The decline marks the sharpest multi-day pullback in nearly two months and reflects growing caution across AI-linked megacap names.
Highlights
- Microsoft closes at $493 after breaking its April uptrend.
- Stock trades below all key EMAs as momentum turns decisively lower.
- Critical support sits at $485–$495 near the 200-day EMA.
With the Nasdaq recording repeated down sessions and liquidity tightening across high-beta technology, Microsoft has shifted from steady leadership to a more vulnerable position ahead of Nvidia’s earnings. Selling pressure has been consistent across the tech complex, with investors moving toward defensive positioning as the AI narrative faces its first meaningful test since summer.
Break of rising trendline shifts Microsoft into corrective territory
The daily chart shows a clean structural break. Microsoft lost its rising trendline during last week’s decline and followed that move with a rejection at both the 20-day and 50-day EMAs. Those levels had supported every pullback since May but now act as resistance. Price trades below all short- and mid-term EMAs, with the 100-day EMA near $502 and the 200-day EMA near $479 defining the next major layers of support.
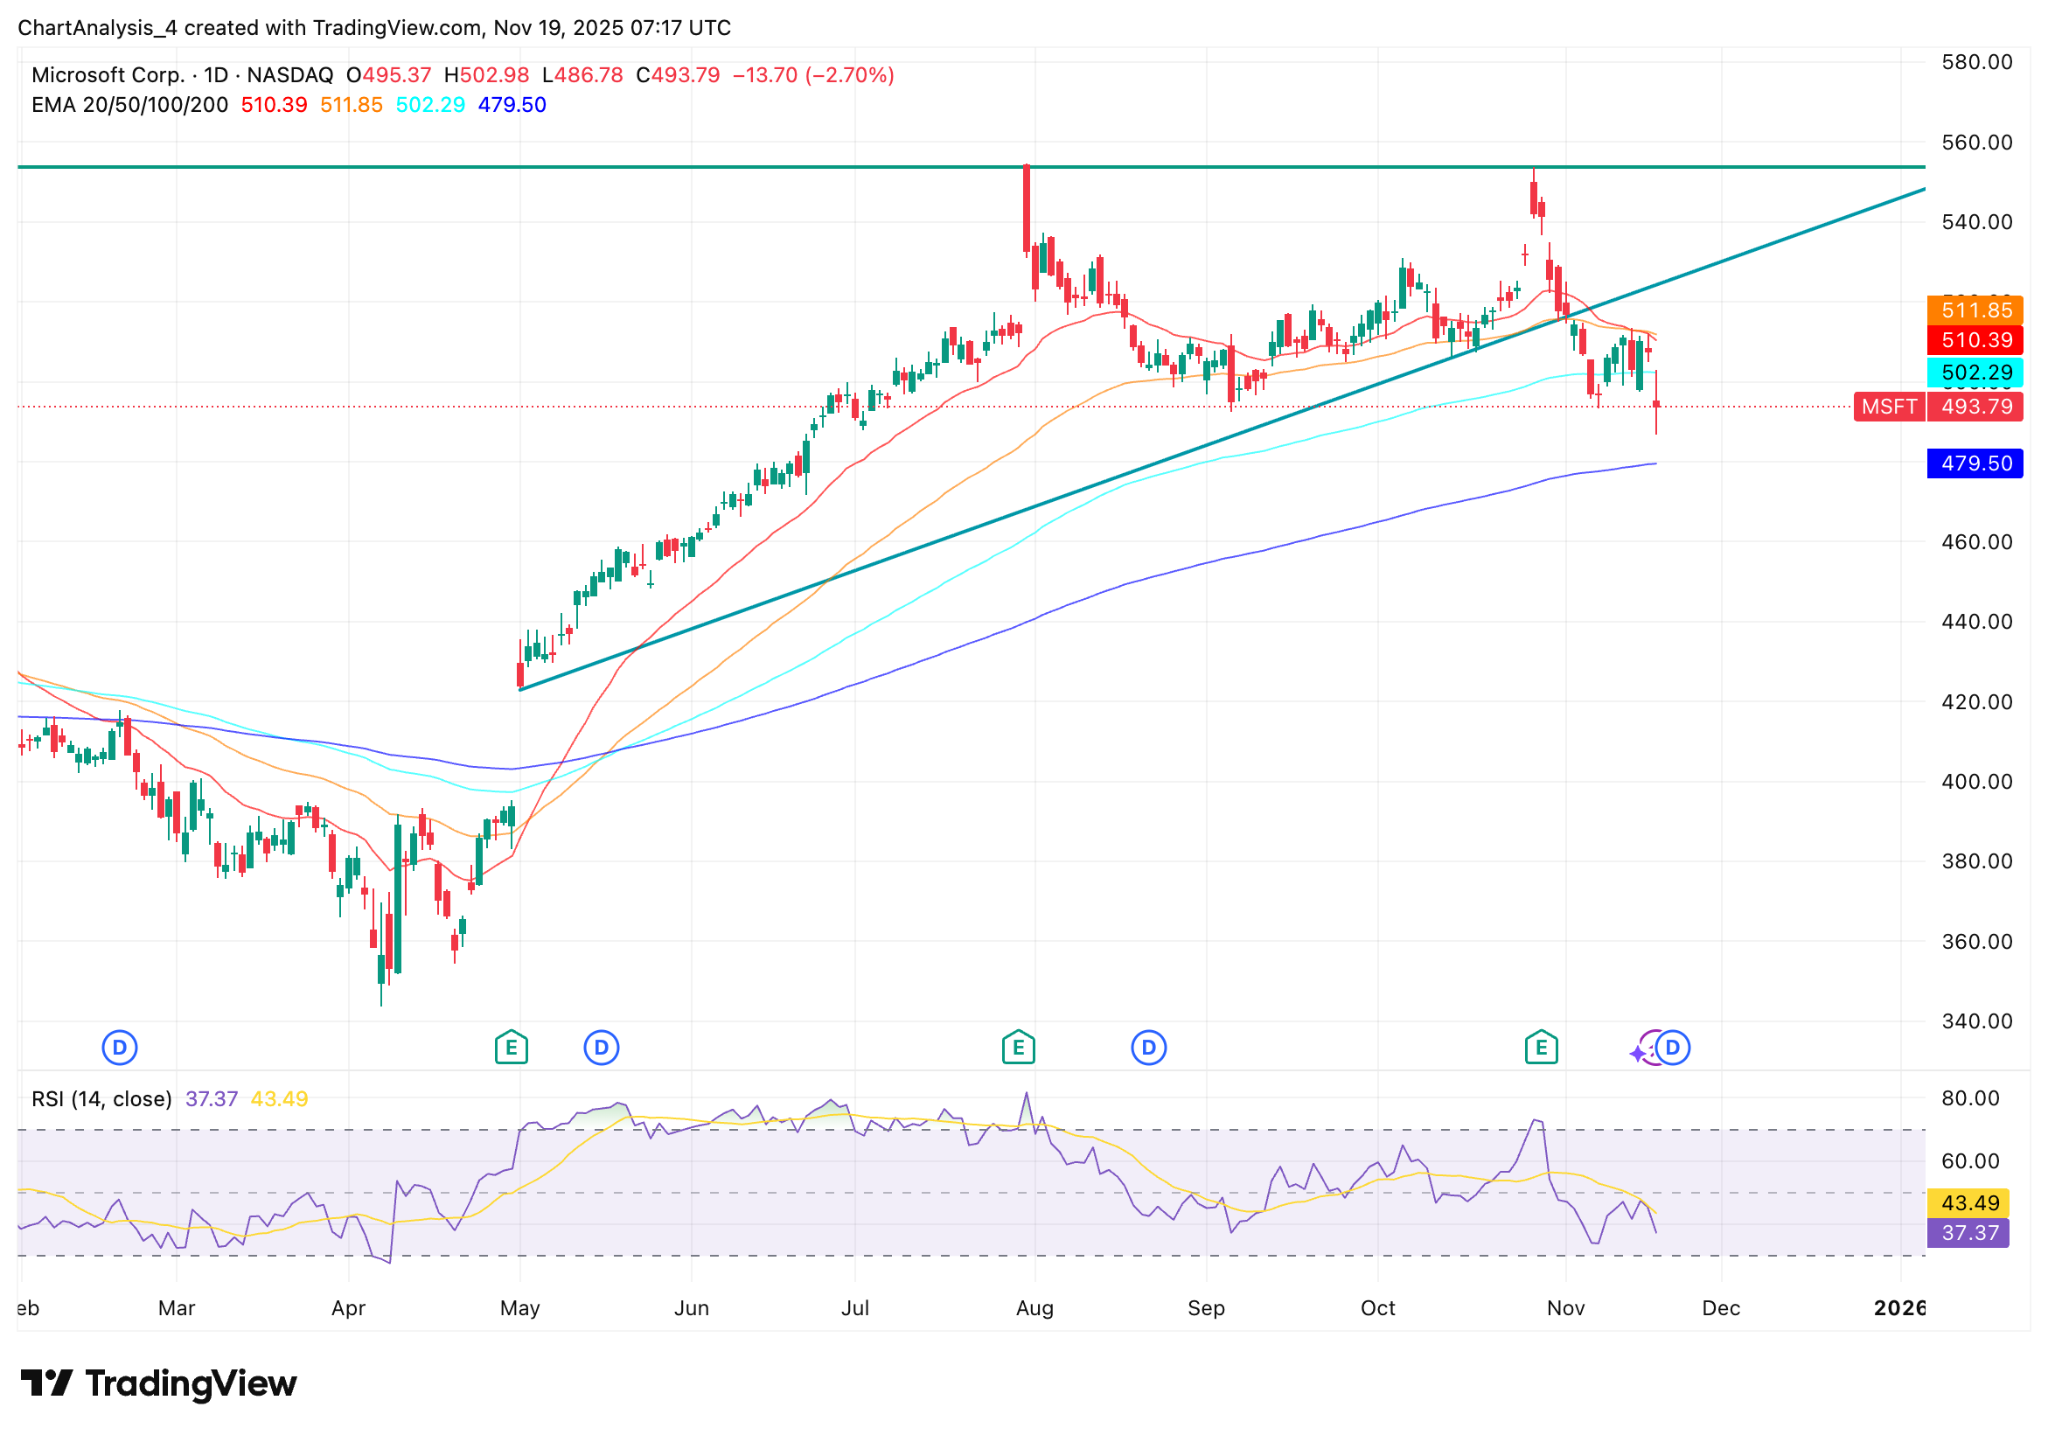
MSFT price dynamics (Source: TradingView)
Momentum readings reinforce the shift. RSI has dropped toward 37, placing the stock close to oversold conditions but still under firm pressure. The decline has been steady rather than volatile, which often signals institutional selling instead of reactive retail moves. Each attempt to rebound toward the $502–$512 region has been rejected, signaling that the previous buy-the-dip rhythm has stalled.
Intraday signals mirror the broader trend. Supertrend remains negative, and every recovery leg has failed as soon as price touched the upper band. DMI readings continue to show a clean directional bias, with sellers firmly in control and no early sign of a reversal.
Critical EMA Levels Now Dictate the Next Move
Microsoft now sits on one of its most important technical zones of the year. The $485–$495 region marks a confluence of the 200-day EMA, prior consolidation from June and a high-volume node that often reflects institutional positioning. Stabilization here would not create an immediate reversal but would slow the decline and allow for a recovery attempt toward $505 and $518. A close above both levels is required to neutralize the current downtrend and rebuild a constructive structure.
A break below $485 carries the greater risk. That move would expose a deeper retracement toward $465, which aligns with the next major liquidity pocket and the early-summer support base. Pressure could intensify if Nvidia’s earnings weigh on AI valuations or if macro sentiment weakens through consumer or enterprise data.
Right now, Microsoft sits in a transition phase. The stock has shifted from sustained leadership into a corrective trend defined by lower highs, EMA rejection and fading momentum. Bulls need the 200-day EMA to stabilize the decline and need confirmation through a close back above $505. Without that shift, Microsoft remains vulnerable as the broader tech sector resets after months of elevated expectations.
Earlier analysis highlighted that Microsoft’s first real test would come at the 200-day EMA once the rising trendline broke. The current decline confirms that setup, with the stock now trading inside the $485–$495 band and showing no confirmed reversal signals yet.


Latest Microsoft News


-
 Afghanistan
-
 Albania
-
 Algeria
-
 Angola
-
 Argentina
-
 Armenia
-
 Australia
-
 Austria
-
 Azerbaijan
-
 Bahamas
-
 Bahrain
-
 Bangladesh
-
 Belarus
-
 Belgium
-
 Bolivia
-
 Botswana
-
 Brazil
-
 Brunei
-
 Bulgaria
-
 Cambodia
-
 Cameroon
-
 Canada
-
 Chile
Chile
-
 China
China
-
 Colombia
-
 Congo
Congo
-
 Costa Rica
-
 Cote d'Ivoire
-
 Croatia
-
 Cuba
Cuba
-
 Cyprus
-
 Czechia
-
 DR Congo
-
 Denmark
-
 Dominican Republic
-
 Ecuador
-
 Egypt
Egypt
-
 El Salvador
-
 Estonia
-
 Eswatini
-
 Ethiopia
-
 Finland
-
 France
-
 Georgia
-
 Germany
-
 Ghana
Ghana
-
 Greece
-
 Haiti
Haiti
-
 Hong Kong
-
 Hungary
-
 India
India
-
 Indonesia
-
 Iran, Islamic republic
-
 Iraq
Iraq
-
 Ireland
-
 Israel
-
 Italy
Italy
-
 Jamaica
-
 Japan
Japan
-
 Jordan
-
 Kazakhstan
-
 Kenya
Kenya
-
 Korea
Korea
-
 Kuwait
-
 Kyrgyzstan
-
 Laos
Laos
-
 Latvia
-
 Lebanon
-
 Lesotho
-
 Libya
Libya
-
 Lithuania
-
 Luxembourg
-
 Madagascar
-
 Malaysia
-
 Malta
Malta
-
 Mauritius
-
 Mexico
-
 Moldova
-
 Mongolia
-
 Montenegro
-
 Morocco
-
 Mozambique
-
 Myanmar
-
 Namibia
-
 Nepal
Nepal
-
 Netherlands
-
 New Zealand
-
 Nigeria
-
 North Macedonia
-
 Norway
-
 Oman
Oman
-
 Pakistan
-
 Palestine
-
 Panama
-
 Papua New Guinea
-
 Paraguay
-
 Peru
Peru
-
 Philippines
-
 Poland
-
 Portugal
-
 Puerto Rico
-
 Qatar
Qatar
-
 Reunion
-
 Romania
-
 Rwanda
-
 Saudi Arabia
-
 Serbia
-
 Singapore
-
 Slovakia
-
 Slovenia
-
 Somalia
-
 South Africa
-
 Spain
Spain
-
 Sri Lanka
-
 Sweden
-
 Switzerland
-
 Syria
Syria
-
 Taiwan
-
 Tajikistan
-
 Tanzania
-
 Thailand
-
 Trinidad and Tobago
-
 Tunisia
-
 Turkey
-
 UAE
UAE
-
 Uganda
-
 Ukraine
-
 United Kingdom
-
United States
-
 Uruguay
-
 Uzbekistan
-
 Venezuela
-
 Vietnam
-
 Yemen
Yemen
-
 Zambia
-
 Zimbabwe
- Forex
- Crypto
