

$2,082 resistance level keeps First Citizens BancShares stock trading flat

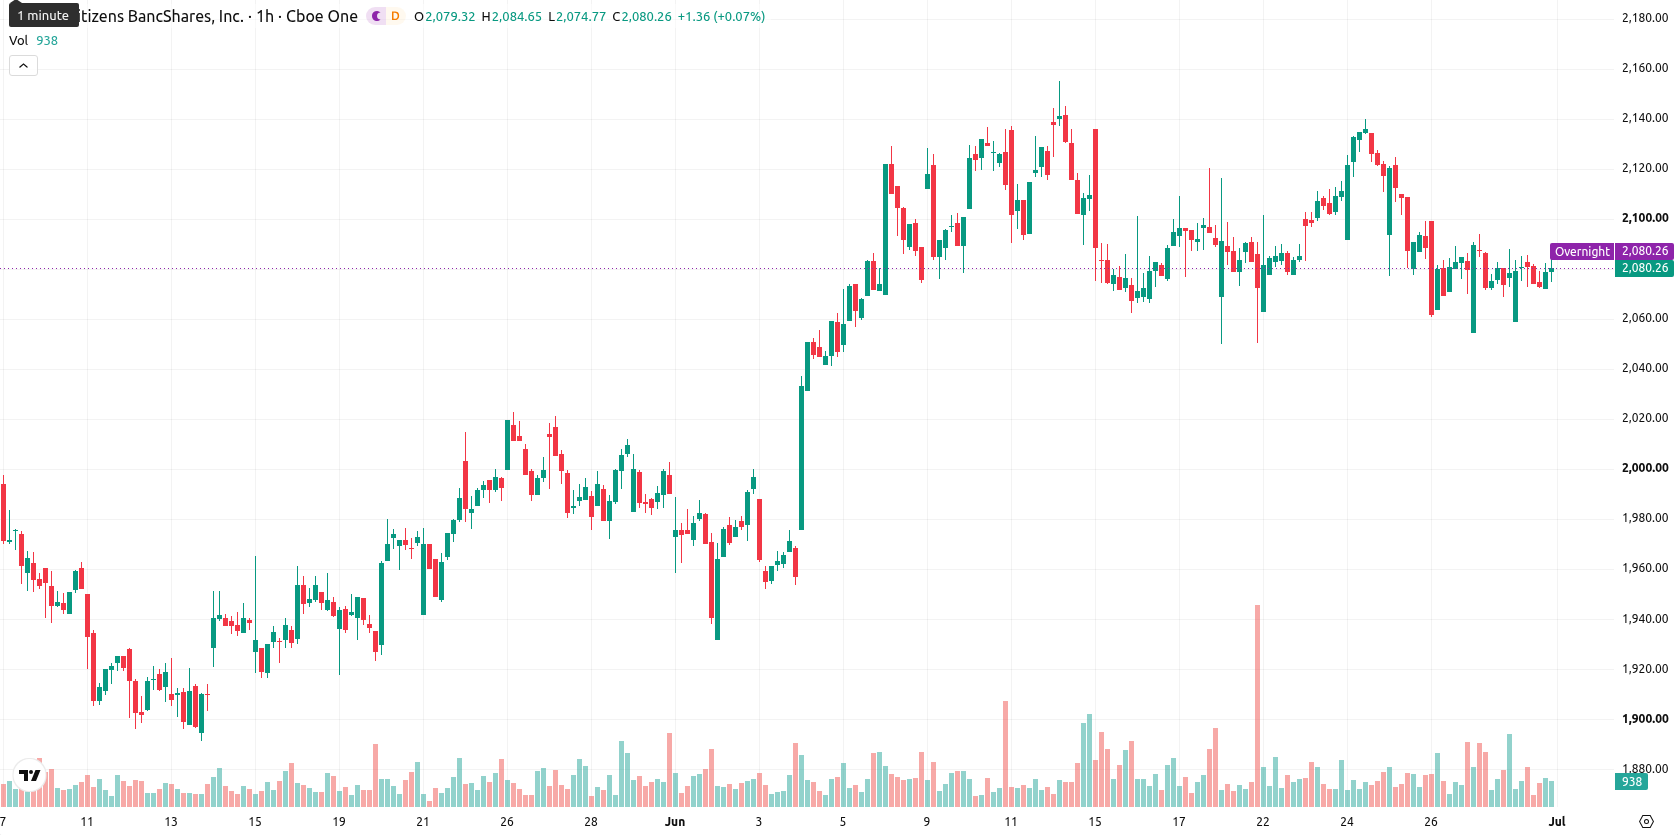
First Citizens BancShares (FCNCA) stock is trading at $2,080, showing a marginal gain for the session. The price has ended the day above its key short-term averages, indicating ongoing short-term support but remains below medium-term averages, suggesting some lingering seller presence.
 2387.57
2400.00
Highlights
- FCNCA exhibits short-term support above the 20-period average but faces medium-term selling pressure and longer-term trend backing.
- Momentum and oscillators collectively suggest prevailing bearish sentiment, though intraday conditions reflect temporary overbought signals and indecision.
- The anticipated trading range is $2,042–$2,118, with 55% probability of downside and critical levels at $2,082 resistance and $2,042 support.
Technical momentum weakens as resistance and overbought signals build
On the hourly chart, FCNCA is positioned above its 20-period moving average while remaining below the 50-period moving average. On the daily timeframe, it is trading above the 200-period moving average. The Ichimoku Kijun line at $2,082 marks the nearest resistance level. Key technical indicators reflect mixed conditions: the Moving Average Convergence Divergence (MACD) and Average Directional Index (ADX) both indicate ongoing selling momentum. The Relative Strength Index (RSI) reads 47.98, suggesting weak selling pressure, while the Stochastic RSI is overbought, signaling potential short-term exhaustion. The Commodity Channel Index (CCI) and Awesome Oscillator are neutral, and Bull/Bear Power (BBP) signals an overbought state, pointing to intraday buyer dominance despite broader momentum favoring sellers.
Sideways bias expected as breakout triggers define directional risk
Over the next several days, FCNCA is expected to fluctuate within a range of $2,042 to $2,118, reflecting typical volatility relative to current levels. Probabilities suggest a 45% chance of an upward move versus a 55% likelihood of further downside. The baseline scenario favors continued sideways movement in this corridor. A bullish scenario would require a break above the $2,082 resistance, while a bearish scenario would be triggered by a drop below the $2,042 support, which could accelerate downward pressure in the near term.






Latest First Citizens BancShares News



-
 Afghanistan
-
 Albania
-
 Algeria
-
 Angola
-
 Argentina
-
 Armenia
-
 Australia
-
 Austria
-
 Azerbaijan
-
 Bahamas
-
 Bahrain
-
 Bangladesh
-
 Belarus
-
 Belgium
-
 Bolivia
-
 Botswana
-
 Brazil
-
 Brunei
-
 Bulgaria
-
 Cambodia
-
 Cameroon
-
 Canada
-
 Chile
-
 China
-
 Colombia
-
 Congo
-
 Costa Rica
-
 Cote d'Ivoire
-
 Croatia
-
 Cuba
-
 Cyprus
-
 Czechia
-
 DR Congo
-
 Denmark
-
 Dominican Republic
-
 Ecuador
-
 Egypt
-
 El Salvador
-
 Estonia
-
 Eswatini
-
 Ethiopia
-
 Finland
-
 France
-
 Georgia
-
 Germany
-
 Ghana
-
 Greece
-
 Haiti
-
 Hong Kong
-
 Hungary
-
 India
-
 Indonesia
-
 Iran, Islamic republic
-
 Iraq
-
 Ireland
-
 Israel
-
 Italy
-
 Jamaica
-
 Japan
-
 Jordan
-
 Kazakhstan
-
 Kenya
-
 Korea
-
 Kuwait
-
 Kyrgyzstan
-
 Laos
-
 Latvia
-
 Lebanon
-
 Lesotho
-
 Libya
-
 Lithuania
-
 Luxembourg
-
 Madagascar
-
 Malaysia
-
 Malta
-
 Mauritius
-
 Mexico
-
 Moldova
-
 Mongolia
-
 Montenegro
-
 Morocco
-
 Mozambique
-
 Myanmar
-
 Namibia
-
 Nepal
-
 Netherlands
-
 New Zealand
-
 Nigeria
-
 North Macedonia
-
 Norway
-
 Oman
-
 Pakistan
-
 Palestine
-
 Panama
-
 Papua New Guinea
-
 Paraguay
-
 Peru
-
 Philippines
-
 Poland
-
 Portugal
-
 Puerto Rico
-
 Qatar
-
 Reunion
-
 Romania
-
 Rwanda
-
 Saudi Arabia
-
 Serbia
-
 Singapore
-
 Slovakia
-
 Slovenia
-
 Somalia
-
 South Africa
-
 Spain
-
 Sri Lanka
-
 Sweden
-
 Switzerland
-
 Syria
-
 Taiwan
-
 Tajikistan
-
 Tanzania
-
 Thailand
-
 Trinidad and Tobago
-
 Tunisia
-
 Turkey
-
 UAE
-
 Uganda
-
 Ukraine
-
 United Kingdom
-
United States
-
 Uruguay
-
 Uzbekistan
-
 Venezuela
-
 Vietnam
-
 Yemen
-
 Zambia
-
 Zimbabwe
- Forex
- Crypto












