

Celsius stock price forecast: $29.19 support holds as CELH slumps 1.71% to $29.28

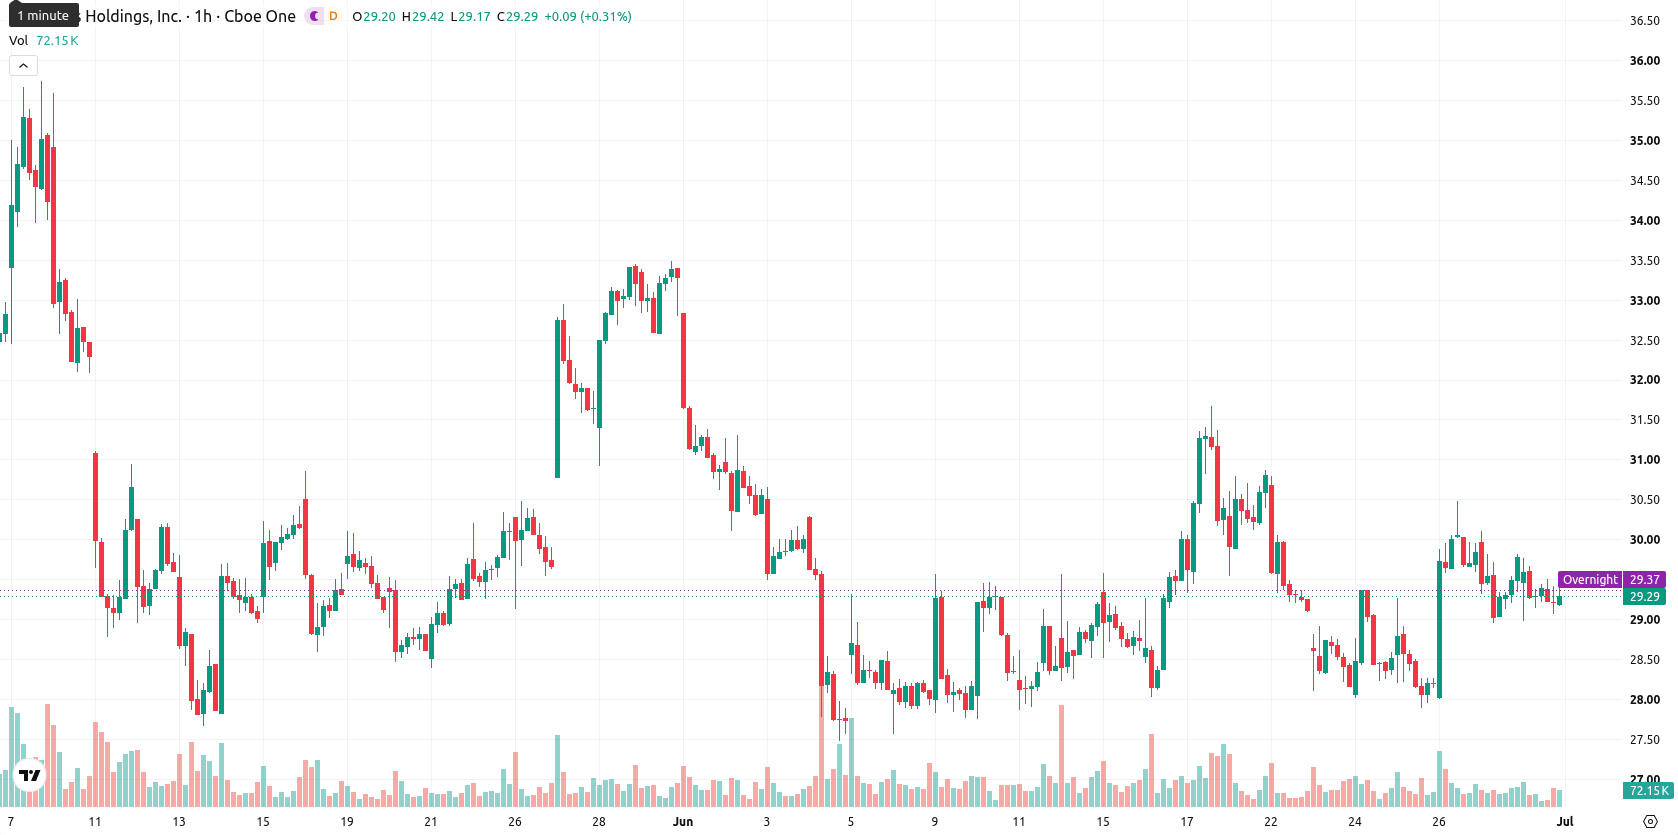
Celsius Holdings (CELH) stock is trading at $29.28, down 1.71% for the day and positioned between its short-term and medium-term averages, yet remains well below its long-term trend lines.
 29.48
29.48
Highlights
- CELH/USD demonstrates mixed short- to medium-term momentum, staying below long-term moving averages and within a wide trading corridor.
- Momentum and oscillators show conflicting signals, with both buyer activity and downward pressure present, indicating no clear trend confirmation.
- The price is expected to range between $28.15 and $30.41 over the coming sessions, with short-term bias favoring a downward move.
Upside signals mixed with conflicting momentum and oversold readings
On the hourly chart, CELH is currently below the 20-period moving average at $29.52, but has held above the 50-period moving average at $29.11. On the daily timeframe, price remains well under the 200-period moving average at $44.05, while the Ichimoku Kijun level at $29.19 is acting as a near-term support. The Moving Average Convergence Divergence (MACD) produces a strong buy signal, while the Average Directional Index (ADX) is neutral, indicating trend strength is unclear despite upside momentum being present. The Relative Strength Index (RSI) is at 49.62 with a sell reading, Commodity Channel Index (CCI) signals sell, and Stochastic RSI is in oversold territory, which is consistent with compressed price action and potential for a short-term rebound. Bull/Bear Power produces a buy signal, suggesting buyers have asserted intraday control, while the Awesome Oscillator is neutral, providing no clear directional bias.
Sideways trading likely as volatility band contains risk
For the next several sessions, CELH is expected to remain in a typical volatility band between $28.15 and $30.41. Forecast probabilities give a 58% chance of a move down and a 42% chance of an upward reversal, so the most likely scenario is continued sideways price action within this corridor. A bullish breakout may develop only on a decisive breach of resistance, while a bearish scenario becomes more likely if price drops through $29.19 or the lower edge of the expected range.











-
 Afghanistan
-
 Albania
-
 Algeria
-
 Angola
-
 Argentina
-
 Armenia
-
 Australia
-
 Austria
-
 Azerbaijan
-
 Bahamas
-
 Bahrain
-
 Bangladesh
-
 Belarus
-
 Belgium
-
 Bolivia
-
 Botswana
-
 Brazil
-
 Brunei
-
 Bulgaria
-
 Cambodia
-
 Cameroon
-
 Canada
-
 Chile
-
 China
-
 Colombia
-
 Congo
-
 Costa Rica
-
 Cote d'Ivoire
-
 Croatia
-
 Cuba
-
 Cyprus
-
 Czechia
-
 DR Congo
-
 Denmark
-
 Dominican Republic
-
 Ecuador
-
 Egypt
-
 El Salvador
-
 Estonia
-
 Eswatini
-
 Ethiopia
-
 Finland
-
 France
-
 Georgia
-
 Germany
-
 Ghana
-
 Greece
-
 Haiti
-
 Hong Kong
-
 Hungary
-
 India
-
 Indonesia
-
 Iran, Islamic republic
-
 Iraq
-
 Ireland
-
 Israel
-
 Italy
-
 Jamaica
-
 Japan
-
 Jordan
-
 Kazakhstan
-
 Kenya
-
 Korea
-
 Kuwait
-
 Kyrgyzstan
-
 Laos
-
 Latvia
-
 Lebanon
-
 Lesotho
-
 Libya
-
 Lithuania
-
 Luxembourg
-
 Madagascar
-
 Malaysia
-
 Malta
-
 Mauritius
-
 Mexico
-
 Moldova
-
 Mongolia
-
 Montenegro
-
 Morocco
-
 Mozambique
-
 Myanmar
-
 Namibia
-
 Nepal
-
 Netherlands
-
 New Zealand
-
 Nigeria
-
 North Macedonia
-
 Norway
-
 Oman
-
 Pakistan
-
 Palestine
-
 Panama
-
 Papua New Guinea
-
 Paraguay
-
 Peru
-
 Philippines
-
 Poland
-
 Portugal
-
 Puerto Rico
-
 Qatar
-
 Reunion
-
 Romania
-
 Rwanda
-
 Saudi Arabia
-
 Serbia
-
 Singapore
-
 Slovakia
-
 Slovenia
-
 Somalia
-
 South Africa
-
 Spain
-
 Sri Lanka
-
 Sweden
-
 Switzerland
-
 Syria
-
 Taiwan
-
 Tajikistan
-
 Tanzania
-
 Thailand
-
 Trinidad and Tobago
-
 Tunisia
-
 Turkey
-
 UAE
-
 Uganda
-
 Ukraine
-
 United Kingdom
-
United States
-
 Uruguay
-
 Uzbekistan
-
 Venezuela
-
 Vietnam
-
 Yemen
-
 Zambia
-
 Zimbabwe
- Forex
- Crypto












