

Salesforce shares test overbought momentum as technical signals conflict: weekly analysis

Shares of Salesforce, Inc. (CRM) are trading near $181 after a strong recovery, rising more than 10% over the past week and signaling robust demand momentum. The chart now shows a stretched setup, with overbought signals emerging and conflicting readings on trend strength, which could lead to hesitation as the new week unfolds.
 216.77
234.21
Highlights
- Salesforce shares surged 10.81% in the past week, staging a strong short-term rebound above key moving averages.
- Despite upside momentum, the stock remains below its long-term trend, indicating an overall bearish structure persists.
- Technical signals suggest overbought conditions and likely consolidation, with an expected trading range of $170.91 to $190.38 and key support at $176.91.
Public-sector contract and AI push boost weekly sentiment despite uncertainty
On July 26 and July 27, 2026, Salesforce secured a three-year Agentic Enterprise License Agreement from the U.S. Department of Veterans Affairs with a contract ceiling of $1.6 billion, according to The Motley Fool and Yahoo Finance. This expands CRM's public-sector reach and accelerates adoption of its AI-driven products across the VA's national network, supporting sentiment for the days ahead. Secondary factors include the recent rollout of Buzz, an open-source Slack rival, though its impact remains to be seen in the near term.
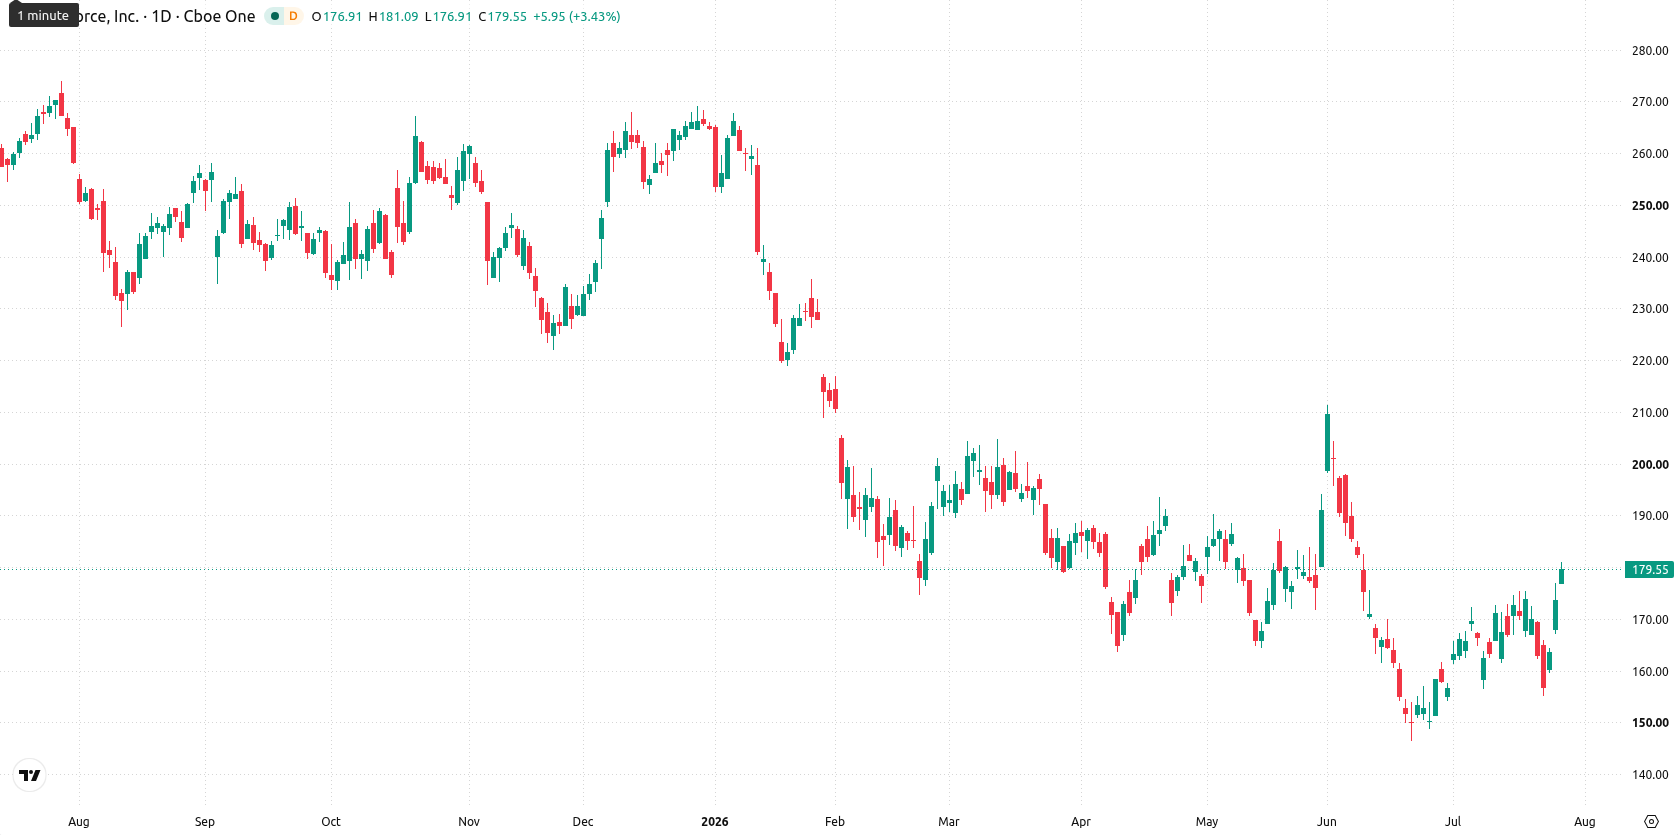
Overbought momentum and weak trend strength flag potential consolidation this week
The daily chart shows a sharp move higher without a sustained trend, as reflected in 14.03% volatility and flat overall trend strength. Bull/Bear Power reads 10.23 and is in an overbought state, while the CCI also signals overbought momentum at 129.76, marking potential exhaustion even as the RSI remains neutral. Nearest support sits at $176.91, while resistance is defined by the 200-day average at $206.25, with the Ichimoku Kijun at $161.61 providing an additional layer beneath. This setup suggests the stock may face consolidation or hesitation after its recent strong advance.
Rangebound outlook this week as breakout and reversal risks intensify
In the week ahead, the expected range is $170.91 to $190.38, with a 55% probability of an increase and a 45% chance of a decline. The base case is continued trading inside this range, with support at $176.91 cushioning pullbacks. A decisive move above $206.25 would signal a bullish break and open up further upside potential, while a move below $176.91 would shift momentum negative and expose shares to further downside risk.
Earlier, analysts noted that Salesforce was experiencing short-term strength but maintained a cautious outlook due to mixed momentum signals and an overall bearish long-term trend. The recent surge in contract wins and price action adds a new dimension to the story, making it crucial for traders to monitor volatility and any break above $206.25 as an inflection point for broader trend reversal.






Latest Salesforce News





-
 Afghanistan
-
 Albania
-
 Algeria
-
 Angola
-
 Argentina
-
 Armenia
-
 Australia
-
 Austria
-
 Azerbaijan
-
 Bahamas
-
 Bahrain
-
 Bangladesh
-
 Belarus
-
 Belgium
-
 Bolivia
-
 Botswana
-
 Brazil
-
 Brunei
-
 Bulgaria
-
 Cambodia
-
 Cameroon
-
 Canada
-
 Chile
-
 China
-
 Colombia
-
 Congo
-
 Costa Rica
-
 Cote d'Ivoire
-
 Croatia
-
 Cuba
-
 Cyprus
-
 Czechia
-
 DR Congo
-
 Denmark
-
 Dominican Republic
-
 Ecuador
-
 Egypt
-
 El Salvador
-
 Estonia
-
 Eswatini
-
 Ethiopia
-
 Finland
-
 France
-
 Georgia
-
 Germany
-
 Ghana
-
 Greece
-
 Haiti
-
 Hong Kong
-
 Hungary
-
 India
-
 Indonesia
-
 Iran, Islamic republic
-
 Iraq
-
 Ireland
-
 Israel
-
 Italy
-
 Jamaica
-
 Japan
-
 Jordan
-
 Kazakhstan
-
 Kenya
-
 Korea
-
 Kuwait
-
 Kyrgyzstan
-
 Laos
-
 Latvia
-
 Lebanon
-
 Lesotho
-
 Libya
-
 Lithuania
-
 Luxembourg
-
 Madagascar
-
 Malaysia
-
 Malta
-
 Mauritius
-
 Mexico
-
 Moldova
-
 Mongolia
-
 Montenegro
-
 Morocco
-
 Mozambique
-
 Myanmar
-
 Namibia
-
 Nepal
-
 Netherlands
-
 New Zealand
-
 Nigeria
-
 North Macedonia
-
 Norway
-
 Oman
-
 Pakistan
-
 Palestine
-
 Panama
-
 Papua New Guinea
-
 Paraguay
-
 Peru
-
 Philippines
-
 Poland
-
 Portugal
-
 Puerto Rico
-
 Qatar
-
 Reunion
-
 Romania
-
 Rwanda
-
 Saudi Arabia
-
 Serbia
-
 Singapore
-
 Slovakia
-
 Slovenia
-
 Somalia
-
 South Africa
-
 Spain
-
 Sri Lanka
-
 Sweden
-
 Switzerland
-
 Syria
-
 Taiwan
-
 Tajikistan
-
 Tanzania
-
 Thailand
-
 Trinidad and Tobago
-
 Tunisia
-
 Turkey
-
 UAE
-
 Uganda
-
 Ukraine
-
 United Kingdom
-
United States
-
 Uruguay
-
 Uzbekistan
-
 Venezuela
-
 Vietnam
-
 Yemen
-
 Zambia
-
 Zimbabwe
- Forex
- Crypto












