

Why is Intel stock down today? Earnings outlook cut and key support levels to watch

Intel (INTC) stock is trading at $83.81 after slipping 3.43% today, with the move leaving shares below their key short- and medium-term moving averages but above the long-term range.
 61.33
64.04
Highlights
- Intel's Q2 2026 non-GAAP EPS of $0.42 and $16.13 billion revenue exceeded forecasts but future profit outlook remains pressured.
- Despite strong results, higher capital expenditures, deeper foundry losses, and mixed institutional activity underscore ongoing profitability concerns.
- Technical indicators show strong downside momentum, with price expected to remain volatile between $74.42 and $93.2 and rebound probability low.
Profit outlook dims despite earnings beat and AI partnership gains
Intel posted second-quarter 2026 non-GAAP earnings of $0.42 per share, nearly doubling analyst expectations, with revenue reaching $16.13 billion, according to Trefis. Despite these strong headline results, concerns emerged over increased capital expenditures, a softer profit outlook, and continued losses in the foundry division, weighing on sentiment around future profitability. Additional developments included new partnerships with Google Cloud for generative AI adoption, as reported by Smallbiztrends, and with Lens Technology to advance glass substrate packaging for AI and high-performance computing chips, noted by Finance Yahoo. Institutional filings cited by MarketBeat showed net reductions by some large holders and new positions by others, signaling mixed long-term positioning as the market responded to Intel’s operational disclosures.
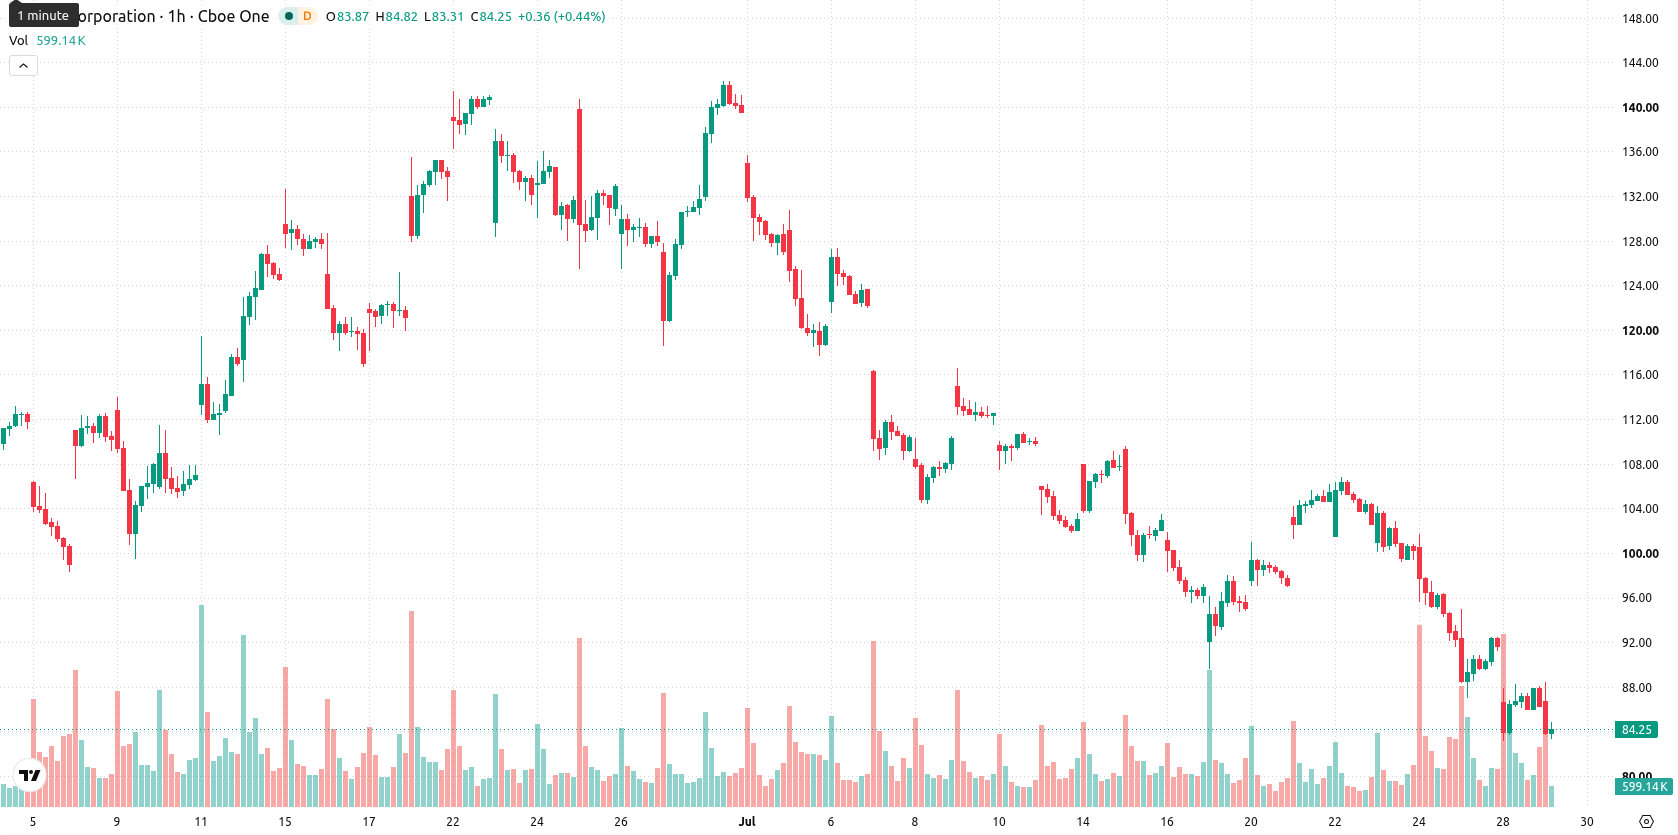
Bearish momentum dominates as price nears oversold territory
On the technical front, INTC trades below its MA-20 at $88.99 and MA-50 at $96.79 on the hourly chart, while remaining above the MA-200 at $66.26 on the daily timeframe. Immediate resistance is established at the Ichimoku Kijun level of $97.1. Momentum remains negative, with MACD signaling a Strong Sell and ADX confirming a Sell bias. The RSI stands at 40.6 (Sell), CCI also flags downside momentum (Sell), and Bull/Bear Power reflects oversold conditions and dominant seller pressure. Notably, the Stochastic RSI is overbought, diverging from the broader bearish momentum, while the Awesome Oscillator is neutral—highlighting a mix of readings among short-term oscillators.
Stabilization likely amid wide volatility and persistent downside risks
In the near term, INTC is expected to trade within a wide volatility band of $74.42 to $93.2. A bullish reversal would require clearing the $97.1 resistance, challenging persistent selling activity. While the probability of sustained upside is rated very low, further declines remain likely if support is breached. The baseline scenario points to prices stabilizing within this range as volatility persists.
Earlier, analysts noted that persistent bearish momentum and weak technical signals continued to dominate the outlook for Intel shares despite underlying long-term support. The latest quarterly results and ongoing volatility confirm the prevailing downside bias, with heightened attention now warranted on whether institutional flows or new strategic partnerships can catalyze a reversal above the established resistance.









-
 Afghanistan
-
 Albania
-
 Algeria
-
 Angola
-
 Argentina
-
 Armenia
-
 Australia
-
 Austria
-
 Azerbaijan
-
 Bahamas
-
 Bahrain
-
 Bangladesh
-
 Belarus
-
 Belgium
-
 Bolivia
-
 Botswana
-
 Brazil
-
 Brunei
-
 Bulgaria
-
 Cambodia
-
 Cameroon
-
 Canada
-
 Chile
-
 China
-
 Colombia
-
 Congo
-
 Costa Rica
-
 Cote d'Ivoire
-
 Croatia
-
 Cuba
-
 Cyprus
-
 Czechia
-
 DR Congo
-
 Denmark
-
 Dominican Republic
-
 Ecuador
-
 Egypt
-
 El Salvador
-
 Estonia
-
 Eswatini
-
 Ethiopia
-
 Finland
-
 France
-
 Georgia
-
 Germany
-
 Ghana
-
 Greece
-
 Haiti
-
 Hong Kong
-
 Hungary
-
 India
-
 Indonesia
-
 Iran, Islamic republic
-
 Iraq
-
 Ireland
-
 Israel
-
 Italy
-
 Jamaica
-
 Japan
-
 Jordan
-
 Kazakhstan
-
 Kenya
-
 Korea
-
 Kuwait
-
 Kyrgyzstan
-
 Laos
-
 Latvia
-
 Lebanon
-
 Lesotho
-
 Libya
-
 Lithuania
-
 Luxembourg
-
 Madagascar
-
 Malaysia
-
 Malta
-
 Mauritius
-
 Mexico
-
 Moldova
-
 Mongolia
-
 Montenegro
-
 Morocco
-
 Mozambique
-
 Myanmar
-
 Namibia
-
 Nepal
-
 Netherlands
-
 New Zealand
-
 Nigeria
-
 North Macedonia
-
 Norway
-
 Oman
-
 Pakistan
-
 Palestine
-
 Panama
-
 Papua New Guinea
-
 Paraguay
-
 Peru
-
 Philippines
-
 Poland
-
 Portugal
-
 Puerto Rico
-
 Qatar
-
 Reunion
-
 Romania
-
 Rwanda
-
 Saudi Arabia
-
 Serbia
-
 Singapore
-
 Slovakia
-
 Slovenia
-
 Somalia
-
 South Africa
-
 Spain
-
 Sri Lanka
-
 Sweden
-
 Switzerland
-
 Syria
-
 Taiwan
-
 Tajikistan
-
 Tanzania
-
 Thailand
-
 Trinidad and Tobago
-
 Tunisia
-
 Turkey
-
 UAE
-
 Uganda
-
 Ukraine
-
 United Kingdom
-
United States
-
 Uruguay
-
 Uzbekistan
-
 Venezuela
-
 Vietnam
-
 Yemen
-
 Zambia
-
 Zimbabwe
- Forex
- Crypto












