

HP stock falls around 5.5% as sellers dominate despite technical bullishness

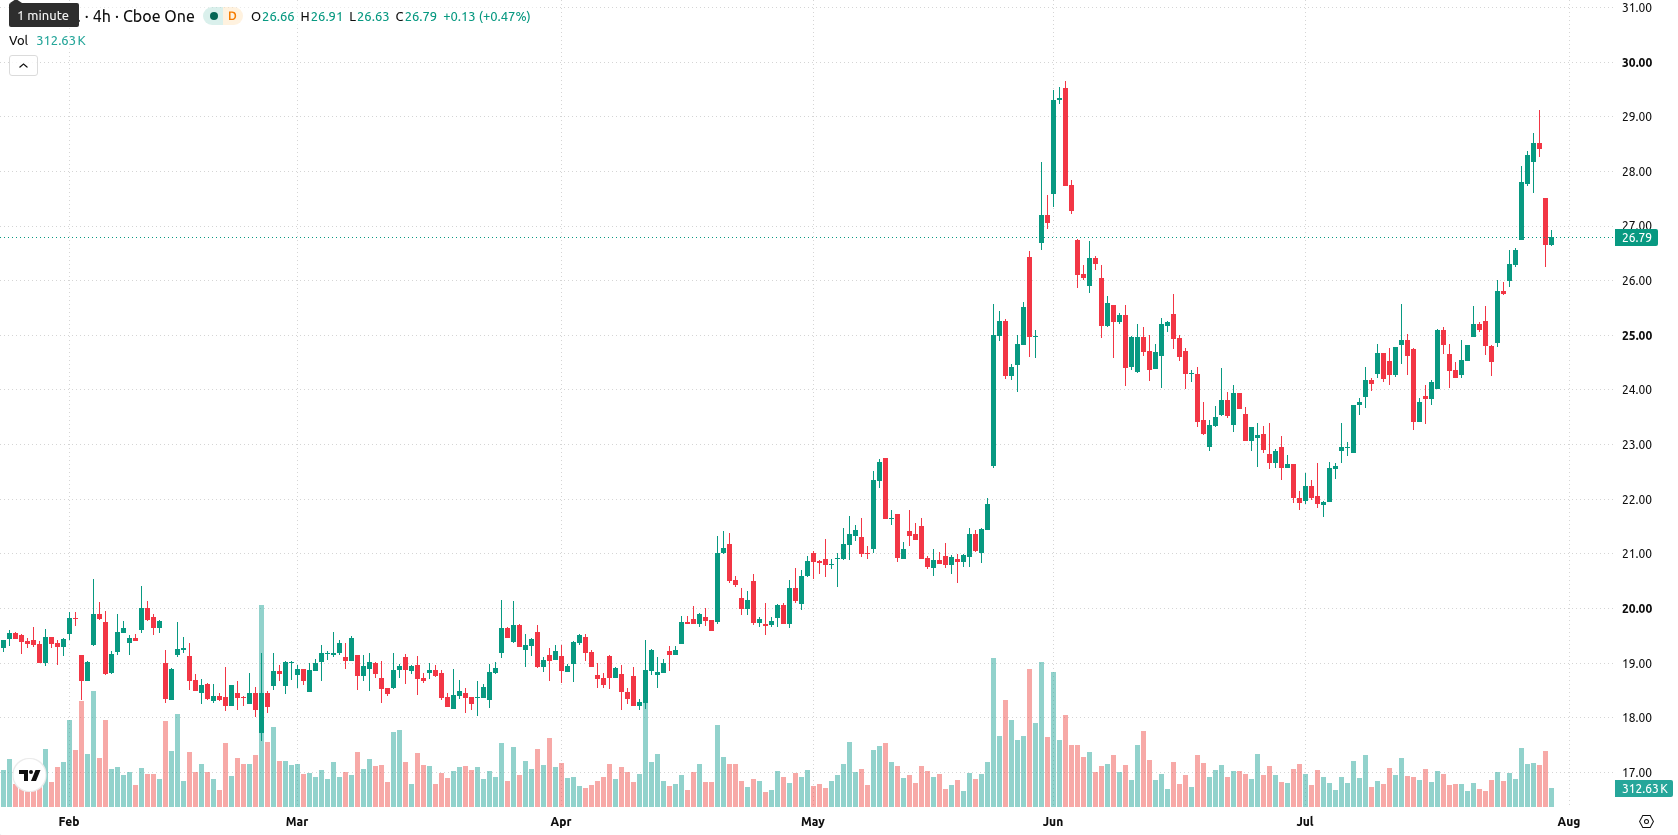
HP Inc. (HPQ) declined 5.42% as sellers dominated the session, with momentum shifting lower even as fundamentals point to undervaluation. The drop contradicts the bullish structure, as the stock remains above short-, medium-, and long-term moving averages with technical signals still aligned to the upside.
 29.78
30.81
Highlights
- HP shares have gained 28.4% year to date and remain undervalued based on discounted cash flow and market multiples.
- Despite steady dividends, the stock faces ongoing selling pressure, tempering its upside momentum from fundamentals.
- Technicals indicate bullish long-term momentum with strong overbought signals; price is projected to consolidate between $24.70 and $29.04, with critical resistance at $27.29.
Discounted valuation tempers returns amid ongoing selling pressure
HP has delivered a 28.4% return year to date. Financial analysis indicated that shares are trading at a discount based on discounted cash flow intrinsic value and market multiples. HP was also identified as a well-established dividend-paying company, though price action has remained under broader selling pressure.
Overbought momentum challenged by intraday volatility and upside fatigue
HP is trading above its 20-day, 50-day, and 200-day moving averages ($24.57, $24.39, and $22.47), confirming ongoing bullish momentum for short, medium, and long-term trends. The near-term ceiling is at $27.29, with support at $26.25, and the Ichimoku Kijun base at $25.39 provides additional trend confirmation. Momentum remains robust according to the MACD and ADX, both showing buy signals. The RSI at 72.56, Stochastic RSI at 100, CCI at 222.85, and Bull/Bear Power at 3.37 all signal strong overbought conditions, indicating buyers dominate intraday dynamics, with the BBP specifically confirming heavy buyer presence. The Awesome Oscillator also supports ongoing bullishness. Despite this, the stock is down $1.54 or 5.42% on the day, reflecting a downside gap of approximately $1.12 (3.94%) at the open. The current price sits mid-range with intraday volatility at 3.96%. Market action shows early pressure and potential exhaustion at higher levels, underscored by overbought signals against further strong upside momentum.
Earlier, analysts noted that HP’s technical profile remained broadly bullish despite increasing regulatory risk and signs of momentum exhaustion. The latest session reinforces this view, with robust upward signals and ongoing overbought conditions arguing for vigilance as a sustained move above $27.29 could open the way to further gains.











-
 Afghanistan
-
 Albania
-
 Algeria
-
 Angola
-
 Argentina
-
 Armenia
-
 Australia
-
 Austria
-
 Azerbaijan
-
 Bahamas
-
 Bahrain
-
 Bangladesh
-
 Belarus
-
 Belgium
-
 Bolivia
-
 Botswana
-
 Brazil
-
 Brunei
-
 Bulgaria
-
 Cambodia
-
 Cameroon
-
 Canada
-
 Chile
-
 China
-
 Colombia
-
 Congo
-
 Costa Rica
-
 Cote d'Ivoire
-
 Croatia
-
 Cuba
-
 Cyprus
-
 Czechia
-
 DR Congo
-
 Denmark
-
 Dominican Republic
-
 Ecuador
-
 Egypt
-
 El Salvador
-
 Estonia
-
 Eswatini
-
 Ethiopia
-
 Finland
-
 France
-
 Georgia
-
 Germany
-
 Ghana
-
 Greece
-
 Haiti
-
 Hong Kong
-
 Hungary
-
 India
-
 Indonesia
-
 Iran, Islamic republic
-
 Iraq
-
 Ireland
-
 Israel
-
 Italy
-
 Jamaica
-
 Japan
-
 Jordan
-
 Kazakhstan
-
 Kenya
-
 Korea
-
 Kuwait
-
 Kyrgyzstan
-
 Laos
-
 Latvia
-
 Lebanon
-
 Lesotho
-
 Libya
-
 Lithuania
-
 Luxembourg
-
 Madagascar
-
 Malaysia
-
 Malta
-
 Mauritius
-
 Mexico
-
 Moldova
-
 Mongolia
-
 Montenegro
-
 Morocco
-
 Mozambique
-
 Myanmar
-
 Namibia
-
 Nepal
-
 Netherlands
-
 New Zealand
-
 Nigeria
-
 North Macedonia
-
 Norway
-
 Oman
-
 Pakistan
-
 Palestine
-
 Panama
-
 Papua New Guinea
-
 Paraguay
-
 Peru
-
 Philippines
-
 Poland
-
 Portugal
-
 Puerto Rico
-
 Qatar
-
 Reunion
-
 Romania
-
 Rwanda
-
 Saudi Arabia
-
 Serbia
-
 Singapore
-
 Slovakia
-
 Slovenia
-
 Somalia
-
 South Africa
-
 Spain
-
 Sri Lanka
-
 Sweden
-
 Switzerland
-
 Syria
-
 Taiwan
-
 Tajikistan
-
 Tanzania
-
 Thailand
-
 Trinidad and Tobago
-
 Tunisia
-
 Turkey
-
 UAE
-
 Uganda
-
 Ukraine
-
 United Kingdom
-
United States
-
 Uruguay
-
 Uzbekistan
-
 Venezuela
-
 Vietnam
-
 Yemen
-
 Zambia
-
 Zimbabwe
- Forex
- Crypto












