

Can Reckitt Benckiser stock regain momentum as oversold conditions limit further selling?

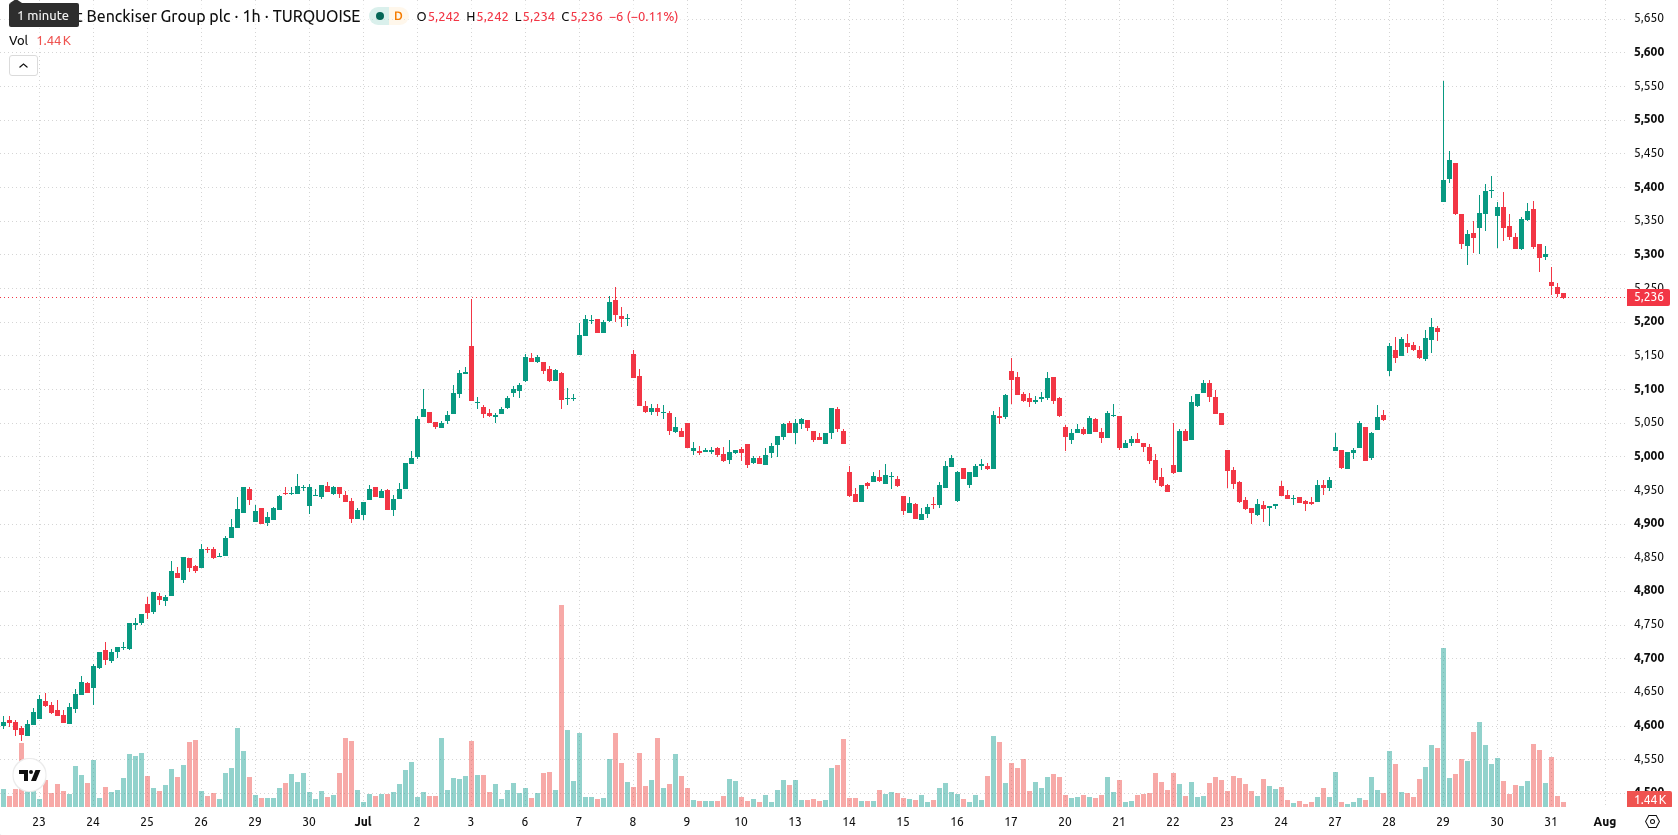
Reckitt Benckiser Group plc (RKT) stock is trading at GBX5,230, marking a daily decline of 1.32%. The price currently sits between its short- and medium-term moving averages, without reclaiming its longer-term benchmarks.
 5716.00
5728.00
Highlights
- RKT/GBX trades below critical short- and long-term moving averages, indicating persistent bearish technical pressure.
- Oscillator signals reveal strong oversold conditions and seller dominance, despite mixed momentum indicators creating a cautious intraday tone.
- Price is expected to stabilize between GBX4,969 and GBX5,490, with a 62% probability of an upward breakout if resistance at GBX5,352 is cleared.
Mixed momentum signals amid stalling under key resistance
On the H1 timeframe, RKT is positioned below the MA-20 (GBX5,341) and above the MA-50 (GBX5,156), but the price remains well under the long-term MA-200 (GBX5,572). The Ichimoku Kijun sits at GBX5,352 and currently serves as immediate resistance. MACD signals strong buying, while ADX points to a buy condition. However, RSI stands at 45.72 and falls in the sell range. Stoch RSI, CCI, and Bull/Bear Power all indicate strong oversold conditions alongside seller dominance, and the Awesome Oscillator maintains a neutral stance. Daily price action reflected a -36 gap and finished close to session lows with reduced volatility. The divergence between momentum and oscillator signals underlines a cautious, uneven intraday environment.
Sideways trade favored as breakout thresholds define outlook
Looking forward, RKT is likely to trade within the GBX4,969 to GBX5,490 band in the short term. The probability of an upside move over the next several days is assessed at 62%, with a 38% likelihood of further downside. Baseline expectations point to continued sideways movement as the price consolidates within this range. A bullish scenario would require a breakout above GBX5,352, potentially opening the path toward the upper boundary of the forecast, while a decline below GBX4,969 could accelerate selling pressure.
Earlier, analysts noted that Reckitt Benckiser’s robust operational performance and capital return strategies underpinned a broadly bullish technical outlook. Current momentum signals now point to a more cautious stance, making a decisive move above GBX5,352 the critical trigger to monitor for any renewed upside.











-
 Afghanistan
-
 Albania
-
 Algeria
-
 Angola
-
 Argentina
-
 Armenia
-
 Australia
-
 Austria
-
 Azerbaijan
-
 Bahamas
-
 Bahrain
-
 Bangladesh
-
 Belarus
-
 Belgium
-
 Bolivia
-
 Botswana
-
 Brazil
-
 Brunei
-
 Bulgaria
-
 Cambodia
-
 Cameroon
-
 Canada
-
 Chile
-
 China
-
 Colombia
-
 Congo
-
 Costa Rica
-
 Cote d'Ivoire
-
 Croatia
-
 Cuba
-
 Cyprus
-
 Czechia
-
 DR Congo
-
 Denmark
-
 Dominican Republic
-
 Ecuador
-
 Egypt
-
 El Salvador
-
 Estonia
-
 Eswatini
-
 Ethiopia
-
 Finland
-
 France
-
 Georgia
-
 Germany
-
 Ghana
-
 Greece
-
 Haiti
-
 Hong Kong
-
 Hungary
-
 India
-
 Indonesia
-
 Iran, Islamic republic
-
 Iraq
-
 Ireland
-
 Israel
-
 Italy
-
 Jamaica
-
 Japan
-
 Jordan
-
 Kazakhstan
-
 Kenya
-
 Korea
-
 Kuwait
-
 Kyrgyzstan
-
 Laos
-
 Latvia
-
 Lebanon
-
 Lesotho
-
 Libya
-
 Lithuania
-
 Luxembourg
-
 Madagascar
-
 Malaysia
-
 Malta
-
 Mauritius
-
 Mexico
-
 Moldova
-
 Mongolia
-
 Montenegro
-
 Morocco
-
 Mozambique
-
 Myanmar
-
 Namibia
-
 Nepal
-
 Netherlands
-
 New Zealand
-
 Nigeria
-
 North Macedonia
-
 Norway
-
 Oman
-
 Pakistan
-
 Palestine
-
 Panama
-
 Papua New Guinea
-
 Paraguay
-
 Peru
-
 Philippines
-
 Poland
-
 Portugal
-
 Puerto Rico
-
 Qatar
-
 Reunion
-
 Romania
-
 Rwanda
-
 Saudi Arabia
-
 Serbia
-
 Singapore
-
 Slovakia
-
 Slovenia
-
 Somalia
-
 South Africa
-
 Spain
-
 Sri Lanka
-
 Sweden
-
 Switzerland
-
 Syria
-
 Taiwan
-
 Tajikistan
-
 Tanzania
-
 Thailand
-
 Trinidad and Tobago
-
 Tunisia
-
 Turkey
-
 UAE
-
 Uganda
-
 Ukraine
-
 United Kingdom
-
United States
-
 Uruguay
-
 Uzbekistan
-
 Venezuela
-
 Vietnam
-
 Yemen
-
 Zambia
-
 Zimbabwe
- Forex
- Crypto












