


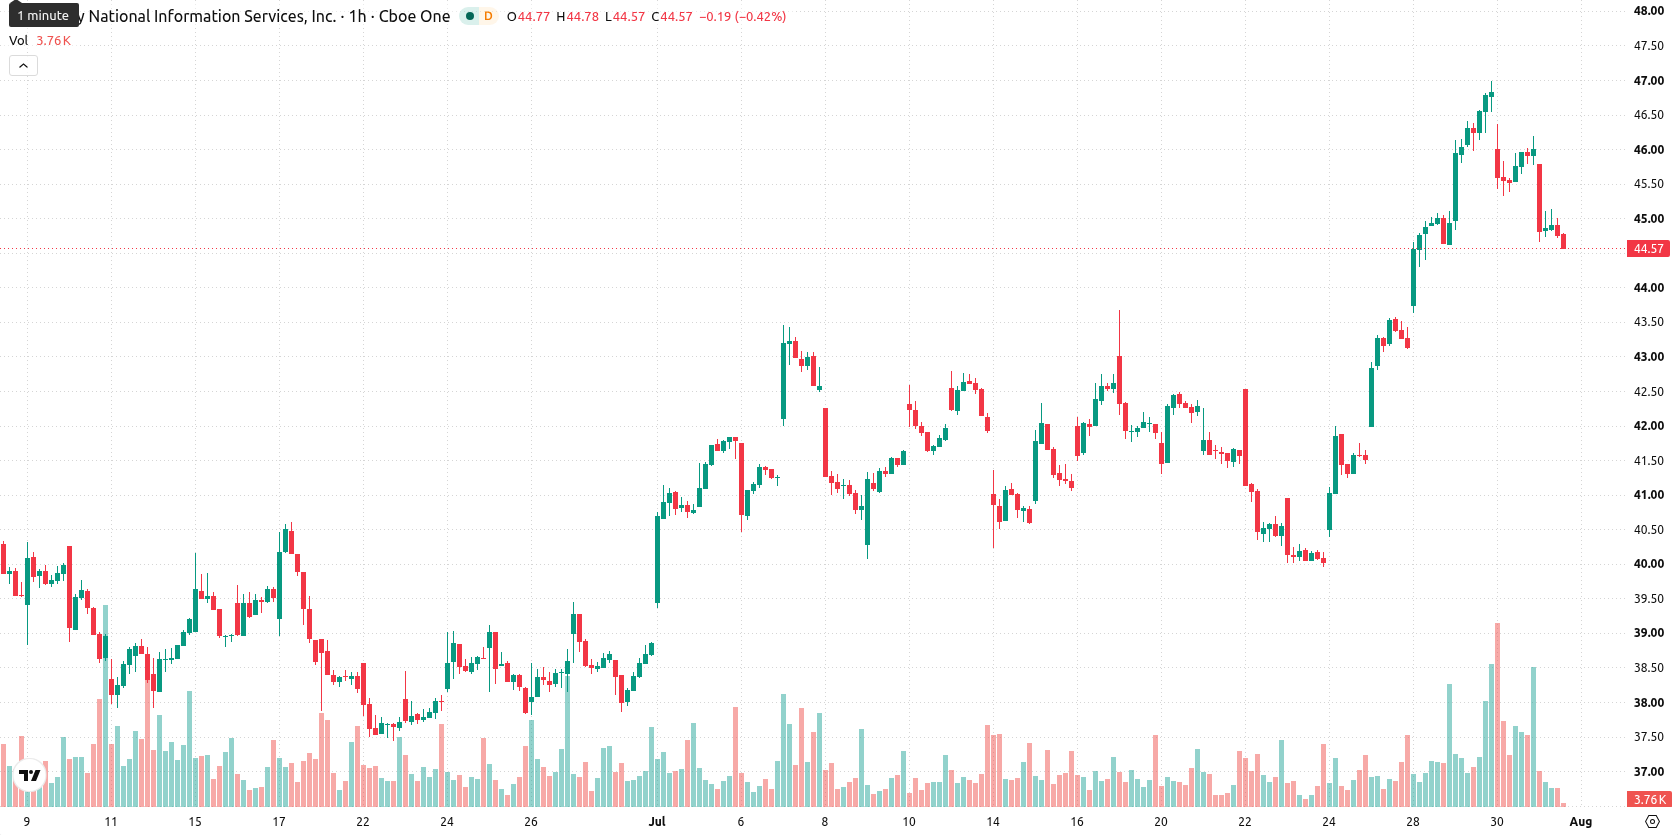
Fidelity National Information Services (FIS) stock is trading at $44.67, marking a daily decline of 2.89%. The price finished near the session’s low, currently positioned below its key short- and long-term moving averages, with some intermediate-term support.
 28.99
40.62
Highlights
- FIS/USD faces prevailing bearish pressure, trading below key moving averages with sellers controlling intraday direction.
- Momentum and oscillator signals conflict, showing strong buying interest but ongoing uncertainty and oversold readings.
- Near-term price expected to range between $42.4 and $46.94, with a 64% probability of sideways or upward movement if resistance is cleared.
Momentum conflicting as resistance and oversold signals converge
On the technical front, FIS is trading below its MA-20 and MA-200 but remains above the MA-50. The Ichimoku Kijun line at $45.05 acts as immediate resistance. Momentum signals are mixed: MACD shows strong buying, ADX signals a buy, while RSI is neutral at 49.21. Stoch RSI and CCI are in oversold territory. Bull/Bear Power points to seller dominance within the session, and the Awesome Oscillator remains neutral, emphasizing directional uncertainty.
Rangebound bias as volatility persists and breakout risks increase
Over the next few sessions, FIS is forecasted to fluctuate within a typical volatility band of $42.4 to $46.94. There is a 64% probability of an upward move, while the likelihood of a downward scenario is 36%. Baseline expectations are for sideways action inside this range, though a decisive break above resistance would trigger a bullish scenario, while a sustained drop below $42.4 would indicate further downside.
Previously, analysts noted that institutional accumulation and strengthening technical momentum were supporting a positive near-term outlook for Fidelity National Information Services. The current shift in momentum underscores the importance of closely monitoring the $42.40 support level, as a decisive move below it could signal further downside beyond the current trading range.






Latest Fidelity News





-
 Afghanistan
-
 Albania
-
 Algeria
-
 Angola
-
 Argentina
-
 Armenia
-
 Australia
-
 Austria
-
 Azerbaijan
-
 Bahamas
-
 Bahrain
-
 Bangladesh
-
 Belarus
-
 Belgium
-
 Bolivia
-
 Botswana
-
 Brazil
-
 Brunei
-
 Bulgaria
-
 Cambodia
-
 Cameroon
-
 Canada
-
 Chile
-
 China
-
 Colombia
-
 Congo
-
 Costa Rica
-
 Cote d'Ivoire
-
 Croatia
-
 Cuba
-
 Cyprus
-
 Czechia
-
 DR Congo
-
 Denmark
-
 Dominican Republic
-
 Ecuador
-
 Egypt
-
 El Salvador
-
 Estonia
-
 Eswatini
-
 Ethiopia
-
 Finland
-
 France
-
 Georgia
-
 Germany
-
 Ghana
-
 Greece
-
 Haiti
-
 Hong Kong
-
 Hungary
-
 India
-
 Indonesia
-
 Iran, Islamic republic
-
 Iraq
-
 Ireland
-
 Israel
-
 Italy
-
 Jamaica
-
 Japan
-
 Jordan
-
 Kazakhstan
-
 Kenya
-
 Korea
-
 Kuwait
-
 Kyrgyzstan
-
 Laos
-
 Latvia
-
 Lebanon
-
 Lesotho
-
 Libya
-
 Lithuania
-
 Luxembourg
-
 Madagascar
-
 Malaysia
-
 Malta
-
 Mauritius
-
 Mexico
-
 Moldova
-
 Mongolia
-
 Montenegro
-
 Morocco
-
 Mozambique
-
 Myanmar
-
 Namibia
-
 Nepal
-
 Netherlands
-
 New Zealand
-
 Nigeria
-
 North Macedonia
-
 Norway
-
 Oman
-
 Pakistan
-
 Palestine
-
 Panama
-
 Papua New Guinea
-
 Paraguay
-
 Peru
-
 Philippines
-
 Poland
-
 Portugal
-
 Puerto Rico
-
 Qatar
-
 Reunion
-
 Romania
-
 Rwanda
-
 Saudi Arabia
-
 Serbia
-
 Singapore
-
 Slovakia
-
 Slovenia
-
 Somalia
-
 South Africa
-
 Spain
-
 Sri Lanka
-
 Sweden
-
 Switzerland
-
 Syria
-
 Taiwan
-
 Tajikistan
-
 Tanzania
-
 Thailand
-
 Trinidad and Tobago
-
 Tunisia
-
 Turkey
-
 UAE
-
 Uganda
-
 Ukraine
-
 United Kingdom
-
United States
-
 Uruguay
-
 Uzbekistan
-
 Venezuela
-
 Vietnam
-
 Yemen
-
 Zambia
-
 Zimbabwe
- Forex
- Crypto












