

GBX5,091 support test: Can RKT avoid deeper losses?

Reckitt Benckiser (RKT) stock is trading at GBX5,256 after a modest decline on the day. The price remains below its key moving averages, signaling continued weakness in the short and long term.
 5716.00
5728.00
Highlights
- Reckitt Benckiser has 674,005,752 ordinary shares issued with each share holding one vote as of July 31, 2026.
- The company holds 38,922,325 ordinary shares in treasury, which temporarily reduces available voting rights and influences governance dynamics.
- Shares of Reckitt Benckiser trade below key moving averages with a bearish short-term trend, and price is expected to range between GBX5,091 and GBX5,420 over the next 2 to 3 days.
Share voting structure shifts as treasury holdings suspend rights
Reckitt Benckiser reported an issued share capital of 674,005,752 ordinary shares as of July 31, 2026, each carrying one vote, according to Investegate Co. In addition, the company holds 38,922,325 ordinary shares in treasury, meaning their voting rights are suspended, a factor that modestly shapes corporate governance. These figures outline the company’s current capital framework and set the background for any upcoming changes involving share capital.
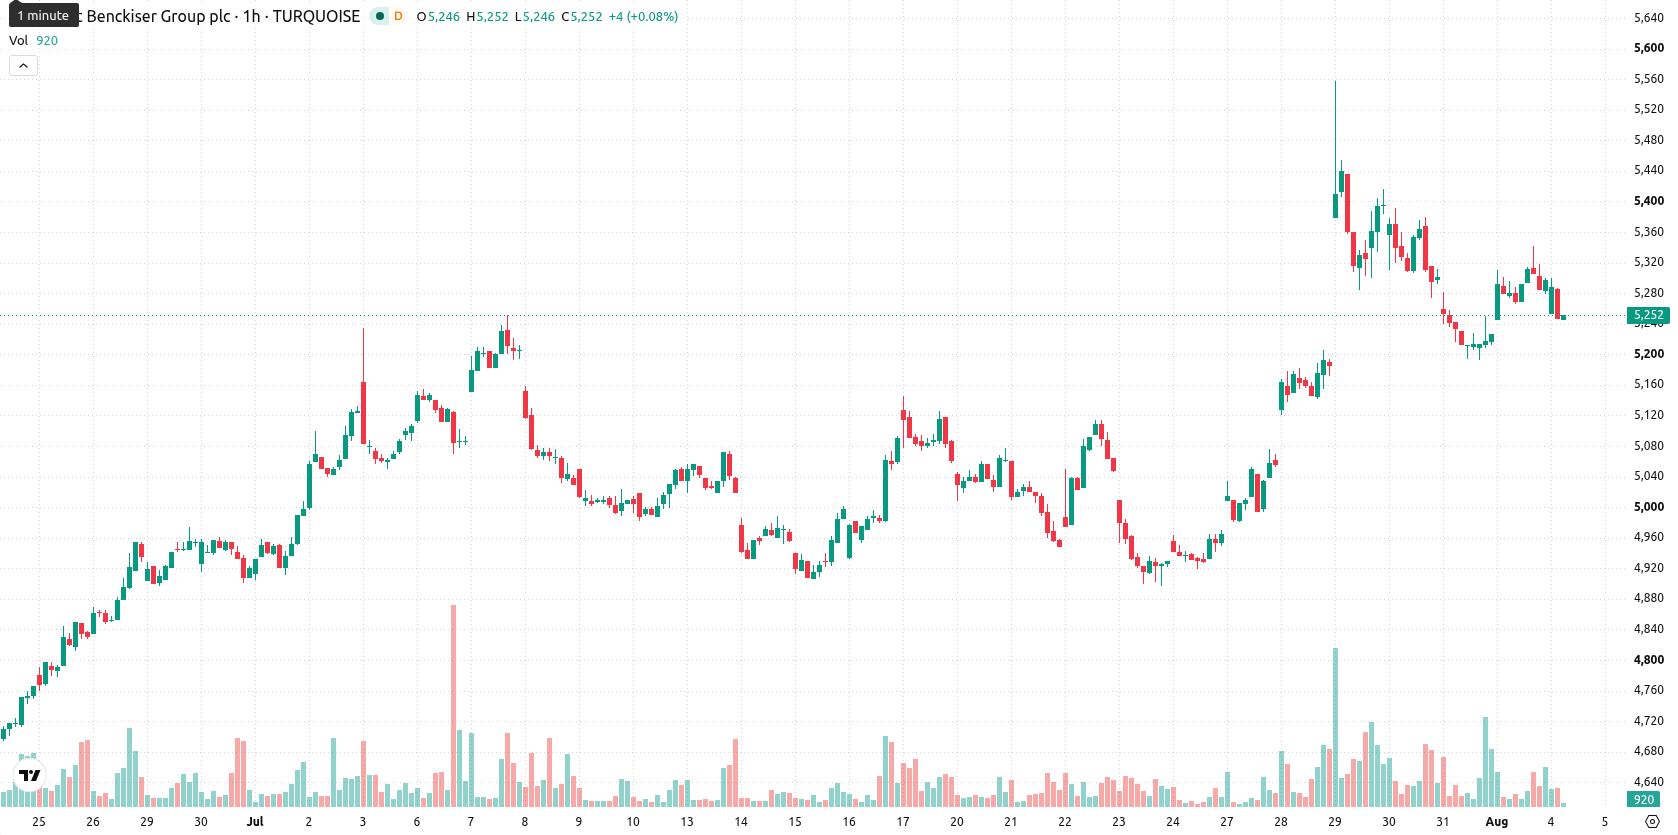
Mixed momentum signals amid resistance at Ichimoku and bearish trend
On the technical front, RKT/GBX is trading below both its MA-20 at GBX5,260 and MA-50 at GBX5,268 on the hourly chart, and it remains under the MA-200 at GBX5,556 on the daily timeframe. Immediate resistance is established at the Ichimoku Kijun level of GBX5,287, with support situated near GBX5,091 and GBX5,420 marking the anticipated trading range. Momentum indicators are sending mixed signals: MACD gives a Strong Buy reading, while ADX is also in Buy territory, hinting at underlying bullish pressure. However, the hourly RSI is at 46.62, a Sell signal, and both CCI and Stochastic RSI are neutral; notably, Bull/Bear Power reads as Overbought, indicating a dominance of sellers intraday. The Awesome Oscillator is currently at Strong Sell, demonstrating negative momentum despite the contradictory picture from trend metrics.
Sideways movement expected unless critical levels are breached
Over the next 2 to 3 trading days, RKT is likely to consolidate within a typical volatility band between GBX5,091 and GBX5,420. There is a 43% probability of an upside move if resistance at GBX5,287 is breached, potentially triggering fresh gains. Conversely, a drop through the support near GBX5,091 would reinforce ongoing downside momentum. The base case scenario anticipates sideways action in the defined corridor, barring a decisive breakout in either direction.
Earlier, analysts noted that while Reckitt Benckiser demonstrated persistent bullish momentum, gains were constrained by resistance across longer-term technical levels. Currently, with the stock trading below key moving averages and mixed momentum signals, continued consolidation within the GBX5,091–5,420 range remains the primary scenario, with a breakout above immediate resistance offering the next notable catalyst.











-
 Afghanistan
-
 Albania
-
 Algeria
-
 Angola
-
 Argentina
-
 Armenia
-
 Australia
-
 Austria
-
 Azerbaijan
-
 Bahamas
-
 Bahrain
-
 Bangladesh
-
 Belarus
-
 Belgium
-
 Bolivia
-
 Botswana
-
 Brazil
-
 Brunei
-
 Bulgaria
-
 Cambodia
-
 Cameroon
-
 Canada
-
 Chile
-
 China
-
 Colombia
-
 Congo
-
 Costa Rica
-
 Cote d'Ivoire
-
 Croatia
-
 Cuba
-
 Cyprus
-
 Czechia
-
 DR Congo
-
 Denmark
-
 Dominican Republic
-
 Ecuador
-
 Egypt
-
 El Salvador
-
 Estonia
-
 Eswatini
-
 Ethiopia
-
 Finland
-
 France
-
 Georgia
-
 Germany
-
 Ghana
-
 Greece
-
 Haiti
-
 Hong Kong
-
 Hungary
-
 India
-
 Indonesia
-
 Iran, Islamic republic
-
 Iraq
-
 Ireland
-
 Israel
-
 Italy
-
 Jamaica
-
 Japan
-
 Jordan
-
 Kazakhstan
-
 Kenya
-
 Korea
-
 Kuwait
-
 Kyrgyzstan
-
 Laos
-
 Latvia
-
 Lebanon
-
 Lesotho
-
 Libya
-
 Lithuania
-
 Luxembourg
-
 Madagascar
-
 Malaysia
-
 Malta
-
 Mauritius
-
 Mexico
-
 Moldova
-
 Mongolia
-
 Montenegro
-
 Morocco
-
 Mozambique
-
 Myanmar
-
 Namibia
-
 Nepal
-
 Netherlands
-
 New Zealand
-
 Nigeria
-
 North Macedonia
-
 Norway
-
 Oman
-
 Pakistan
-
 Palestine
-
 Panama
-
 Papua New Guinea
-
 Paraguay
-
 Peru
-
 Philippines
-
 Poland
-
 Portugal
-
 Puerto Rico
-
 Qatar
-
 Reunion
-
 Romania
-
 Rwanda
-
 Saudi Arabia
-
 Serbia
-
 Singapore
-
 Slovakia
-
 Slovenia
-
 Somalia
-
 South Africa
-
 Spain
-
 Sri Lanka
-
 Sweden
-
 Switzerland
-
 Syria
-
 Taiwan
-
 Tajikistan
-
 Tanzania
-
 Thailand
-
 Trinidad and Tobago
-
 Tunisia
-
 Turkey
-
 UAE
-
 Uganda
-
 Ukraine
-
 United Kingdom
-
United States
-
 Uruguay
-
 Uzbekistan
-
 Venezuela
-
 Vietnam
-
 Yemen
-
 Zambia
-
 Zimbabwe
- Forex
- Crypto












