

PepsiCo shares face resistance at $138.59 with price action consolidating at key levels: weekly analysis

Shares of PepsiCo, Inc. (PEP) are holding near $138 as the stock struggles to break through resistance after a week of muted movement. The chart shows a tug-of-war between bearish momentum and overbought signals, keeping the setup mixed as consolidation continues for the week ahead.
 142.08
145.50
Highlights
- PepsiCo stock remains in a bearish long-term structure, trading below key moving averages following a $1.25 decline over the past week.
- Price action is consolidating near resistance with volatility at 4.7%, while momentum indicators reflect both a sell bias and overbought conditions.
- Expected trading range for the week is $135.39 to $142.36, with downside risk prevailing unless $138.59 resistance is breached.
Dividend approval and leadership changes drive corporate momentum this week
According to Yahoo Finance, PepsiCo's Board approved a quarterly dividend of US$1.48 per share, payable on September 30, 2026 to shareholders of record as of September 4, 2026, reinforcing a commitment to shareholder returns. In addition, PepsiCo appointed Tanvi Swami as Marketing Director for flagship beverage brands and finalized a multi-year deal as Official Soft Drink of the Tampa Bay Buccaneers. First Nebraska Trust Co's reported acquisition of 69,431 PEP shares and the company's new growth initiatives, mentioned by The Motley Fool and Kalkine Media, add to the week's corporate momentum.
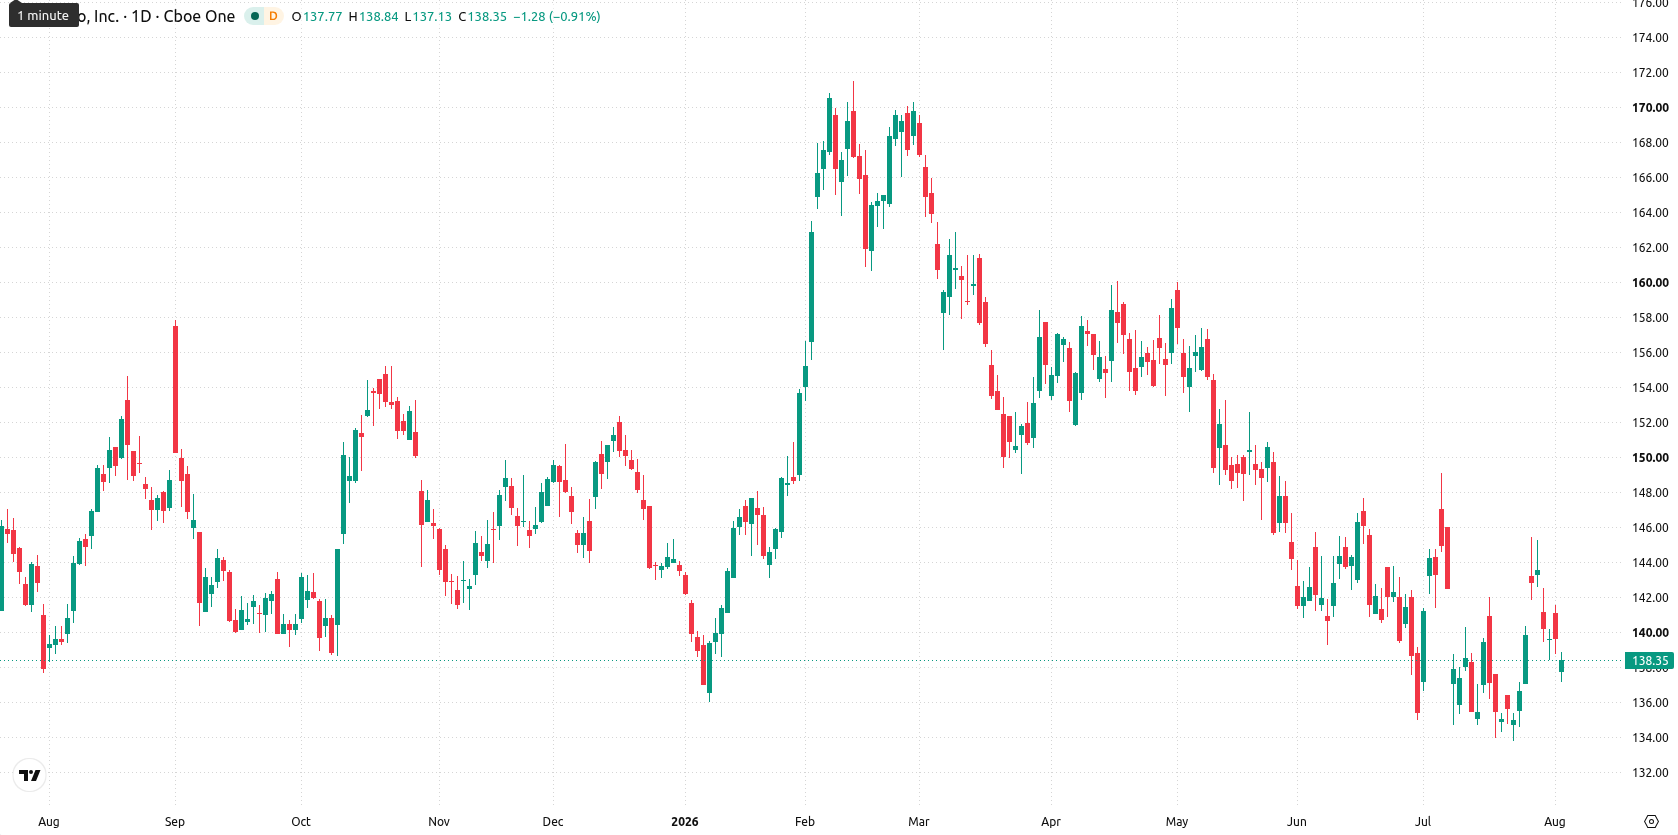
Bearish momentum clashes with overbought signals as range holds over the week
The daily chart shows PepsiCo confined to a contained move within a narrow range as volatility over the past week measured 4.7%. MACD continues to point lower with a strong sell bias at -0.2, while Bull/Bear Power reflects an overbought condition, creating a divergence in momentum signals. The stock is holding at resistance from both the MA-20 ($138.59) and the Ichimoku Kijun ($141.39), capping upward attempts. With no clear trend in place, price action is consolidating near key resistance.
Consolidation bias for next week as downside risk outweighs breakout
For the coming trading week, the expected range is $135.39 to $142.36. There is a 33% probability of an increase and a 67% probability of a decrease. The base case is continued consolidation between $135.39 and resistance at $138.59. A sustained move above $138.59 could open a test of $141.39, while loss of support at $135.39 would signal further downside risk.
Earlier, analysts noted that PepsiCo was experiencing strong institutional accumulation while facing regulatory headwinds, leading to expectations for continued consolidation within a defined range. This week’s mixed momentum signals and ongoing resistance near key technical levels confirm the ongoing consolidation scenario, with a decisive move above $138.59 or below $135.39 likely to set the direction for the next leg.









-
 Afghanistan
-
 Albania
-
 Algeria
-
 Angola
-
 Argentina
-
 Armenia
-
 Australia
-
 Austria
-
 Azerbaijan
-
 Bahamas
-
 Bahrain
-
 Bangladesh
-
 Belarus
-
 Belgium
-
 Bolivia
-
 Botswana
-
 Brazil
-
 Brunei
-
 Bulgaria
-
 Cambodia
-
 Cameroon
-
 Canada
-
 Chile
-
 China
-
 Colombia
-
 Congo
-
 Costa Rica
-
 Cote d'Ivoire
-
 Croatia
-
 Cuba
-
 Cyprus
-
 Czechia
-
 DR Congo
-
 Denmark
-
 Dominican Republic
-
 Ecuador
-
 Egypt
-
 El Salvador
-
 Estonia
-
 Eswatini
-
 Ethiopia
-
 Finland
-
 France
-
 Georgia
-
 Germany
-
 Ghana
-
 Greece
-
 Haiti
-
 Hong Kong
-
 Hungary
-
 India
-
 Indonesia
-
 Iran, Islamic republic
-
 Iraq
-
 Ireland
-
 Israel
-
 Italy
-
 Jamaica
-
 Japan
-
 Jordan
-
 Kazakhstan
-
 Kenya
-
 Korea
-
 Kuwait
-
 Kyrgyzstan
-
 Laos
-
 Latvia
-
 Lebanon
-
 Lesotho
-
 Libya
-
 Lithuania
-
 Luxembourg
-
 Madagascar
-
 Malaysia
-
 Malta
-
 Mauritius
-
 Mexico
-
 Moldova
-
 Mongolia
-
 Montenegro
-
 Morocco
-
 Mozambique
-
 Myanmar
-
 Namibia
-
 Nepal
-
 Netherlands
-
 New Zealand
-
 Nigeria
-
 North Macedonia
-
 Norway
-
 Oman
-
 Pakistan
-
 Palestine
-
 Panama
-
 Papua New Guinea
-
 Paraguay
-
 Peru
-
 Philippines
-
 Poland
-
 Portugal
-
 Puerto Rico
-
 Qatar
-
 Reunion
-
 Romania
-
 Rwanda
-
 Saudi Arabia
-
 Serbia
-
 Singapore
-
 Slovakia
-
 Slovenia
-
 Somalia
-
 South Africa
-
 Spain
-
 Sri Lanka
-
 Sweden
-
 Switzerland
-
 Syria
-
 Taiwan
-
 Tajikistan
-
 Tanzania
-
 Thailand
-
 Trinidad and Tobago
-
 Tunisia
-
 Turkey
-
 UAE
-
 Uganda
-
 Ukraine
-
 United Kingdom
-
United States
-
 Uruguay
-
 Uzbekistan
-
 Venezuela
-
 Vietnam
-
 Yemen
-
 Zambia
-
 Zimbabwe
- Forex
- Crypto












