

Telus stock forecast: Dividend cut and C$12.28 support in focus

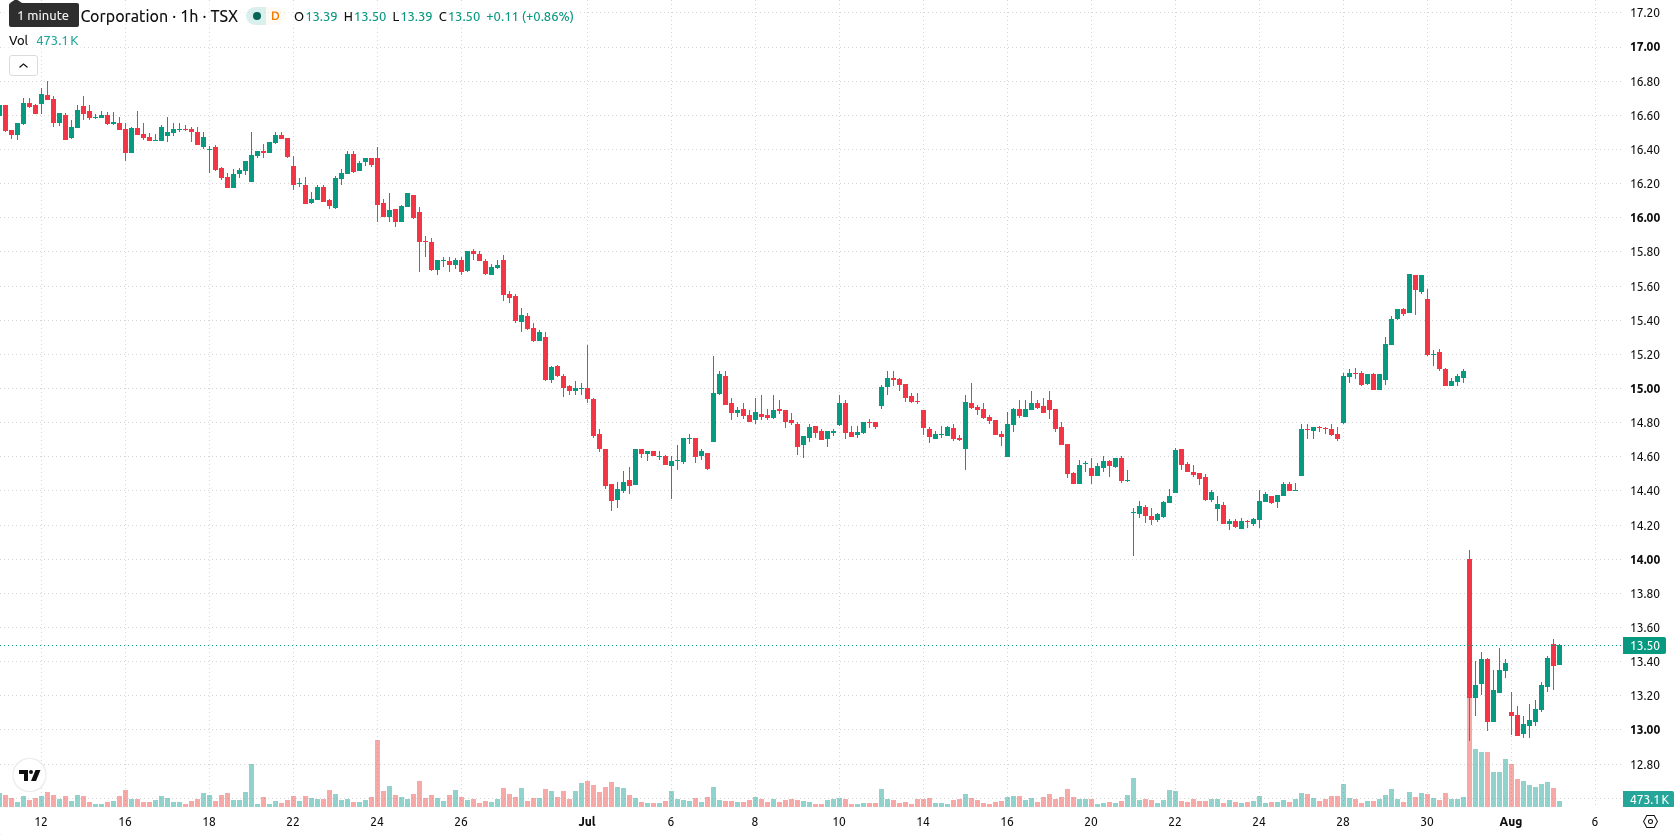
Telus (T) stock is trading at C$13.45, closing out the session with a modest daily gain. The price remains below its key short- and long-term moving averages.
 13.79
13.80
Highlights
- Telus slashed its quarterly dividend by 55% and reduced 2026 guidance to prioritize debt reduction after a major impairment charge.
- The company raised cellphone plan prices and increased roaming caps in August to help lift near-term revenue per user amid ongoing cost pressures.
- Telus stock remains under broad selling pressure with a 2 to 3 day range forecast of C$12.28 to C$14.62 and a 70% likelihood of downside.
Dividend slash and guidance cut as debt reduction takes priority
Telus implemented a 55% reduction to its quarterly dividend and significantly cut its 2026 financial guidance, making these changes to free up capital for debt reduction after reporting weaker-than-expected second-quarter earnings and a C$2.1 billion non-cash impairment at TELUS Digital, according to Investing.com. This move reflects the company's priority to strengthen its balance sheet at the expense of returns to shareholders, which has implications for both liquidity and investor sentiment. Additionally, Telus increased the price of its cellphone plans by C$5 and adjusted daily roaming fee caps to match market competitors in early August, as reported by Iphoneincanada, supporting revenue per user in the near term. Together, these developments signal a period of operational adjustment for Telus amid recently heightened cost pressures and subdued earnings.
Downtrend persists amid conflicting technical and momentum signals
T remains below major technical thresholds, with the MA-20 at C$13.59, MA-50 at C$14.42, and the longer-term MA-200 at C$17.75, all above the current price. The Ichimoku Kijun sits at C$14.3, representing immediate resistance. On the indicator front, MACD confirms a Strong Sell, ADX suggests a Sell bias, and RSI stands at 40.58 in a Sell region. However, Stochastic RSI is Overbought, CCI appears Neutral, Bull/Bear Power registers a Strong Buy pointing to active intraday buyers, while Awesome Oscillator remains neutral. These conflicting signals highlight the absence of a clear directional consensus in the short term.
Downside risk elevated as volatility bands frame near-term outlook
In the days ahead, T is expected to trade in a typical volatility band between C$12.28 and C$14.62. There is a 30% probability of an upside move versus 70% for a decline, suggesting downward risk outweighs the chance for a rebound. The baseline view calls for the price to consolidate within a sideways range. Should T surpass the Kijun resistance at C$14.3, a push towards the upper range limit is possible, while a drop below support may trigger a test of the C$12.28 level.
Previously it was reported that Telus faced heightened downside risk after a significant dividend cut and reduced financial guidance, with technical indicators reflecting persistent bearish momentum. The current analysis adds new complexity with mixed technical signals and recent operational adjustments, highlighting C$14.3 as a critical resistance level to monitor for any potential shift in price direction.






Latest Telus News




-
 Afghanistan
-
 Albania
-
 Algeria
-
 Angola
-
 Argentina
-
 Armenia
-
 Australia
-
 Austria
-
 Azerbaijan
-
 Bahamas
-
 Bahrain
-
 Bangladesh
-
 Belarus
-
 Belgium
-
 Bolivia
-
 Botswana
-
 Brazil
-
 Brunei
-
 Bulgaria
-
 Cambodia
-
 Cameroon
-
 Canada
-
 Chile
-
 China
-
 Colombia
-
 Congo
-
 Costa Rica
-
 Cote d'Ivoire
-
 Croatia
-
 Cuba
-
 Cyprus
-
 Czechia
-
 DR Congo
-
 Denmark
-
 Dominican Republic
-
 Ecuador
-
 Egypt
-
 El Salvador
-
 Estonia
-
 Eswatini
-
 Ethiopia
-
 Finland
-
 France
-
 Georgia
-
 Germany
-
 Ghana
-
 Greece
-
 Haiti
-
 Hong Kong
-
 Hungary
-
 India
-
 Indonesia
-
 Iran, Islamic republic
-
 Iraq
-
 Ireland
-
 Israel
-
 Italy
-
 Jamaica
-
 Japan
-
 Jordan
-
 Kazakhstan
-
 Kenya
-
 Korea
-
 Kuwait
-
 Kyrgyzstan
-
 Laos
-
 Latvia
-
 Lebanon
-
 Lesotho
-
 Libya
-
 Lithuania
-
 Luxembourg
-
 Madagascar
-
 Malaysia
-
 Malta
-
 Mauritius
-
 Mexico
-
 Moldova
-
 Mongolia
-
 Montenegro
-
 Morocco
-
 Mozambique
-
 Myanmar
-
 Namibia
-
 Nepal
-
 Netherlands
-
 New Zealand
-
 Nigeria
-
 North Macedonia
-
 Norway
-
 Oman
-
 Pakistan
-
 Palestine
-
 Panama
-
 Papua New Guinea
-
 Paraguay
-
 Peru
-
 Philippines
-
 Poland
-
 Portugal
-
 Puerto Rico
-
 Qatar
-
 Reunion
-
 Romania
-
 Rwanda
-
 Saudi Arabia
-
 Serbia
-
 Singapore
-
 Slovakia
-
 Slovenia
-
 Somalia
-
 South Africa
-
 Spain
-
 Sri Lanka
-
 Sweden
-
 Switzerland
-
 Syria
-
 Taiwan
-
 Tajikistan
-
 Tanzania
-
 Thailand
-
 Trinidad and Tobago
-
 Tunisia
-
 Turkey
-
 UAE
-
 Uganda
-
 Ukraine
-
 United Kingdom
-
United States
-
 Uruguay
-
 Uzbekistan
-
 Venezuela
-
 Vietnam
-
 Yemen
-
 Zambia
-
 Zimbabwe
- Forex
- Crypto












