

Dutch Bros shares rise over 3% as bullish technical momentum drives upside gap

Dutch Bros Inc (BROS) surged 3.24% as bullish technical momentum drove an upside gap and firm trading near the day's high. The move is supported by the price holding above all major moving averages, even as mixed signals from momentum indicators point to limited conviction.
 36.00
36.52
Highlights
- Dutch Bros stock maintains a broadly bullish trend, trading above short-, medium-, and long-term moving averages.
- Technical momentum indicators are mixed, with neutral to mildly bearish signals but buyers retaining a slight advantage intraday.
- Expected trading range for the next five days is $64.05 to $68.34, with key resistance at $68.08 and support at $66.14.
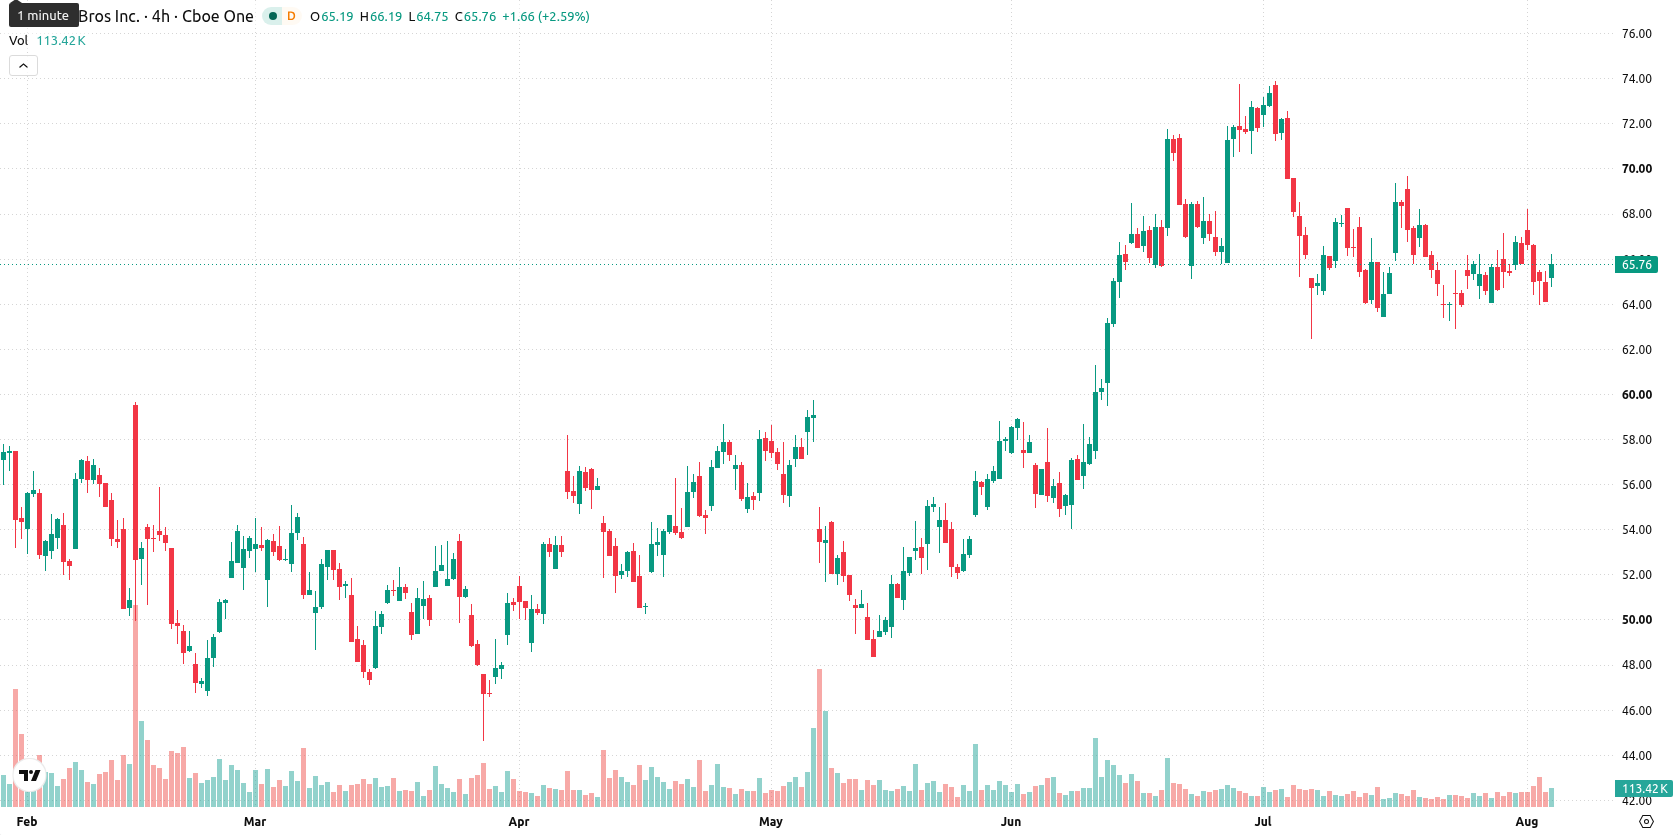
Broad trend up as mixed momentum signals confront technical resistance
Dutch Bros is trading above its short-, medium-, and long-term moving averages, with the price at $66.19 versus the MA-20 of $65.34, the MA-50 of $64.11, and the MA-200 of $57.79. This alignment confirms a broadly bullish trend, although the Ichimoku Kijun at $68.08 acts as near-term resistance, with immediate support at $66.14. Momentum signals remain mixed. The Moving Average Convergence Divergence (MACD) reads neutral, and the Average Directional Index (ADX) indicates a lack of strong trend. The Relative Strength Index (RSI) at 46.4 signals a mild bearish undertone, and Commodity Channel Index (CCI) is at -79.96, forecasting a sell. The Stochastic RSI and Bull/Bear Power (BBP) both signal oversold conditions, with buyers still holding a slight edge intraday as BBP sits in positive territory at 0.24. After an upside gap of approximately $0.69 (1.08%), the stock is trading near the day’s high, up $2.08 or 3.24%, and daily volatility stands at 2.15%. The tone is firm near the highs, although contradictory momentum indicators highlight a split between near-term weakness and underlying buyer support.
Earlier, analysts noted that Dutch Bros was facing technical weakness despite longer-term expansion initiatives supporting the stock. The current discussion highlights a technical shift, with price now trading above key moving averages; near-term focus should be on whether the stock can maintain support above $66.14 or break resistance at $68.08 to signal the next directional move.










-
 Afghanistan
-
 Albania
-
 Algeria
-
 Angola
-
 Argentina
-
 Armenia
-
 Australia
-
 Austria
-
 Azerbaijan
-
 Bahamas
-
 Bahrain
-
 Bangladesh
-
 Belarus
-
 Belgium
-
 Bolivia
-
 Botswana
-
 Brazil
-
 Brunei
-
 Bulgaria
-
 Cambodia
-
 Cameroon
-
 Canada
-
 Chile
-
 China
-
 Colombia
-
 Congo
-
 Costa Rica
-
 Cote d'Ivoire
-
 Croatia
-
 Cuba
-
 Cyprus
-
 Czechia
-
 DR Congo
-
 Denmark
-
 Dominican Republic
-
 Ecuador
-
 Egypt
-
 El Salvador
-
 Estonia
-
 Eswatini
-
 Ethiopia
-
 Finland
-
 France
-
 Georgia
-
 Germany
-
 Ghana
-
 Greece
-
 Haiti
-
 Hong Kong
-
 Hungary
-
 India
-
 Indonesia
-
 Iran, Islamic republic
-
 Iraq
-
 Ireland
-
 Israel
-
 Italy
-
 Jamaica
-
 Japan
-
 Jordan
-
 Kazakhstan
-
 Kenya
-
 Korea
-
 Kuwait
-
 Kyrgyzstan
-
 Laos
-
 Latvia
-
 Lebanon
-
 Lesotho
-
 Libya
-
 Lithuania
-
 Luxembourg
-
 Madagascar
-
 Malaysia
-
 Malta
-
 Mauritius
-
 Mexico
-
 Moldova
-
 Mongolia
-
 Montenegro
-
 Morocco
-
 Mozambique
-
 Myanmar
-
 Namibia
-
 Nepal
-
 Netherlands
-
 New Zealand
-
 Nigeria
-
 North Macedonia
-
 Norway
-
 Oman
-
 Pakistan
-
 Palestine
-
 Panama
-
 Papua New Guinea
-
 Paraguay
-
 Peru
-
 Philippines
-
 Poland
-
 Portugal
-
 Puerto Rico
-
 Qatar
-
 Reunion
-
 Romania
-
 Rwanda
-
 Saudi Arabia
-
 Serbia
-
 Singapore
-
 Slovakia
-
 Slovenia
-
 Somalia
-
 South Africa
-
 Spain
-
 Sri Lanka
-
 Sweden
-
 Switzerland
-
 Syria
-
 Taiwan
-
 Tajikistan
-
 Tanzania
-
 Thailand
-
 Trinidad and Tobago
-
 Tunisia
-
 Turkey
-
 UAE
-
 Uganda
-
 Ukraine
-
 United Kingdom
-
United States
-
 Uruguay
-
 Uzbekistan
-
 Venezuela
-
 Vietnam
-
 Yemen
-
 Zambia
-
 Zimbabwe
- Forex
- Crypto












