

EOG Resources shares drop more than 6% after Q2 earnings report and elevated production guidance

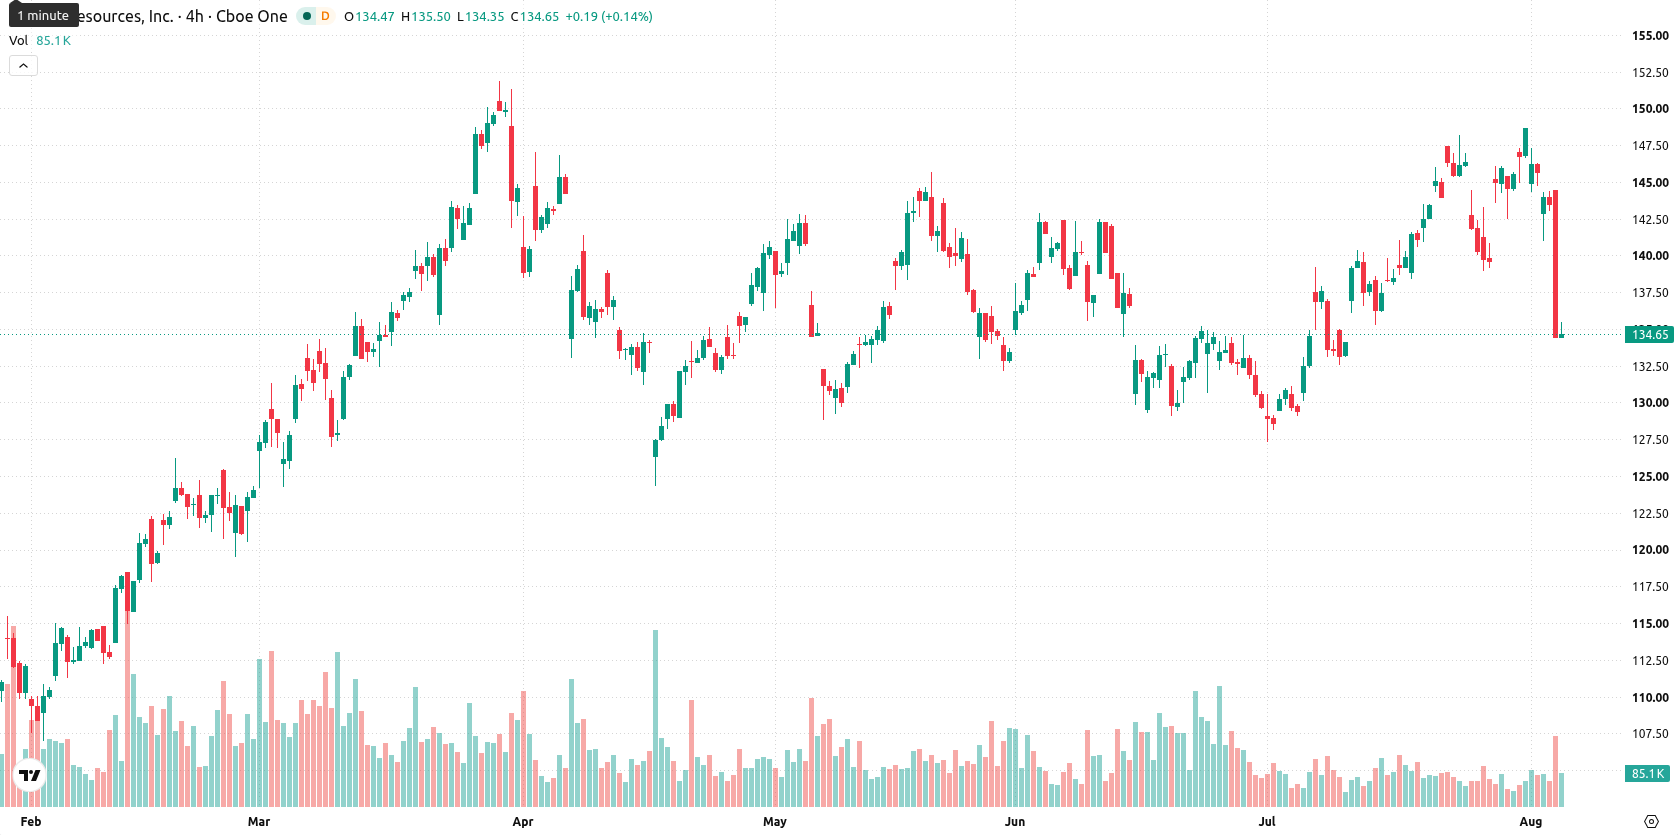
EOG Resources Inc (EOG) plunged 6.31% after a sharp selloff, even as the company reported a surge in second quarter profit and ongoing shareholder returns. The slide is at odds with a bullish long-term technical setup, as EOG continues to hold well above its 200-day moving average, indicating broader downside remains limited by structural support.
 158.37
158.37
158.37
Highlights
- EOG Resources reported second-quarter net income of $2.72 billion, more than doubling year over year due to higher oil prices and a 24% production increase.
- The company returned approximately $1.8 billion to shareholders through dividends and buybacks, with $11.7 billion remaining under its share repurchase authorization.
- Shares of EOG Resources face persistent short-term selling pressure but remain in a long-term bullish alignment, with an expected range of $127.07 to $138.34 over the next five days.
Earnings, dividends and buybacks rise as selling pressure persists
EOG Resources, Inc. declared a quarterly dividend of $1.02 per share, payable on October 30 to shareholders of record on October 16. The company reported net income of $2.72 billion, or $5.15 per share, for the second quarter of 2026, more than double the year-ago level, reflecting higher oil prices and a 24% rise in production. EOG bought back 9.6 million shares and had $11.7 billion remaining under its authorization, returning roughly $1.8 billion through dividends and repurchases. Initial oil production began in the United Arab Emirates with test wells producing strong results, though price action has remained under broader selling pressure.
Short-term weakness contrasts with bullish long-term technical alignment
EOG is trading below both its 20-day and 50-day moving averages at $141.42 and $137.50, while remaining well above the 200-day moving average at $124.32. This positioning confirms a bullish long-term alignment but highlights ongoing short- and medium-term selling pressure. Support is immediate at the session's low of $134.36, with resistance at the 50-day moving average of $137.50 and the Ichimoku Kijun at $138. Momentum indicators are mixed: the MACD has a buy bias, the ADX is neutral, and the RSI at 54.67 is paired with a buy forecast. The Stochastic RSI is deeply oversold at 15.98, the CCI is neutral, and BBP at 1.05 suggests buyers are dominant intraday, even as BBP enters overbought territory. The Awesome Oscillator shows a neutral reading. Intraday volatility measured 6.51%, reflecting significant price swings and persistent downside pressure after the opening gap.
In a recent review, analysts highlighted how major energy companies are rebalancing portfolios and prioritizing shareholder returns through asset sales and capital allocation initiatives. EOG Resources' continued focus on buybacks and dividends, against the backdrop of resilient long-term technical support, positions $134.36 as a crucial level to watch for traders assessing near-term downside risk.




Latest EOG Resources Inc News




-
 Afghanistan
-
 Albania
-
 Algeria
-
 Angola
-
 Argentina
-
 Armenia
-
 Australia
-
 Austria
-
 Azerbaijan
-
 Bahamas
-
 Bahrain
-
 Bangladesh
-
 Belarus
-
 Belgium
-
 Bolivia
-
 Botswana
-
 Brazil
-
 Brunei
-
 Bulgaria
-
 Cambodia
-
 Cameroon
-
 Canada
-
 Chile
Chile
-
 China
China
-
 Colombia
-
 Congo
Congo
-
 Costa Rica
-
 Cote d'Ivoire
-
 Croatia
-
 Cuba
Cuba
-
 Cyprus
-
 Czechia
-
 DR Congo
-
 Denmark
-
 Dominican Republic
-
 Ecuador
-
 Egypt
Egypt
-
 El Salvador
-
 Estonia
-
 Eswatini
-
 Ethiopia
-
 Finland
-
 France
-
 Georgia
-
 Germany
-
 Ghana
Ghana
-
 Greece
-
 Haiti
Haiti
-
 Hong Kong
-
 Hungary
-
 India
India
-
 Indonesia
-
 Iran, Islamic republic
-
 Iraq
Iraq
-
 Ireland
-
 Israel
-
 Italy
Italy
-
 Jamaica
-
 Japan
Japan
-
 Jordan
-
 Kazakhstan
-
 Kenya
Kenya
-
 Korea
Korea
-
 Kuwait
-
 Kyrgyzstan
-
 Laos
Laos
-
 Latvia
-
 Lebanon
-
 Lesotho
-
 Libya
Libya
-
 Lithuania
-
 Luxembourg
-
 Madagascar
-
 Malaysia
-
 Malta
Malta
-
 Mauritius
-
 Mexico
-
 Moldova
-
 Mongolia
-
 Montenegro
-
 Morocco
-
 Mozambique
-
 Myanmar
-
 Namibia
-
 Nepal
Nepal
-
 Netherlands
-
 New Zealand
-
 Nigeria
-
 North Macedonia
-
 Norway
-
 Oman
Oman
-
 Pakistan
-
 Palestine
-
 Panama
-
 Papua New Guinea
-
 Paraguay
-
 Peru
Peru
-
 Philippines
-
 Poland
-
 Portugal
-
 Puerto Rico
-
 Qatar
Qatar
-
 Reunion
-
 Romania
-
 Rwanda
-
 Saudi Arabia
-
 Serbia
-
 Singapore
-
 Slovakia
-
 Slovenia
-
 Somalia
-
 South Africa
-
 Spain
Spain
-
 Sri Lanka
-
 Sweden
-
 Switzerland
-
 Syria
Syria
-
 Taiwan
-
 Tajikistan
-
 Tanzania
-
 Thailand
-
 Trinidad and Tobago
-
 Tunisia
-
 Turkey
-
 UAE
UAE
-
 Uganda
-
 Ukraine
-
 United Kingdom
-
United States
-
 Uruguay
-
 Uzbekistan
-
 Venezuela
-
 Vietnam
-
 Yemen
Yemen
-
 Zambia
-
 Zimbabwe
- Forex
- Crypto












