

Liberty Global shares fall over 3% as technical selling and overhead resistance weigh on price

Liberty Global plc (LBTYA) fell 3.11% as technical selling dominated, driven by the stock's failure to overcome medium- and long-term moving averages and persistent overbought readings in key oscillators. The move is supported by lingering bearish momentum and strong overhead resistance at higher levels.
 8.20
8.20
Highlights
- Liberty Global stock faces persistent medium- and long-term selling pressure despite short-term support above the 20-day average.
- Price momentum is mixed, with positive buyer control but several overbought indicators signaling elevated caution for new positions.
- Shares are expected to trade between $10.16 and $11 over the next five sessions, with downside risk outweighing upside prospects.
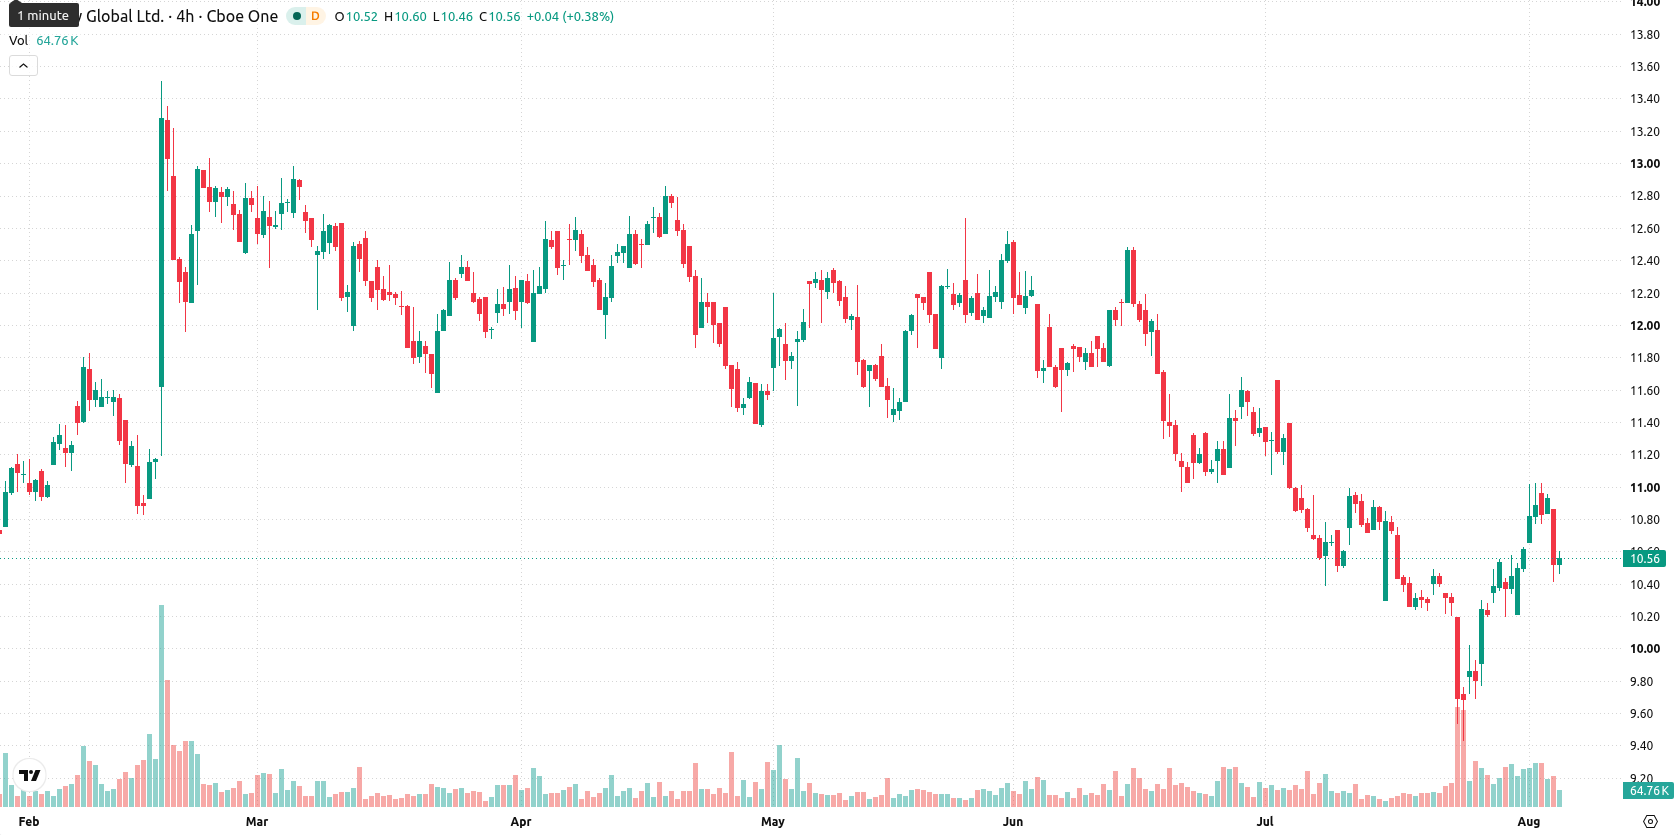
Short-term support and conflicting momentum as oscillators diverge
Liberty Global is trading above its 20-day moving average ($10.49) but remains below the 50-day ($11.2) and 200-day ($11.45) moving averages. This configuration points to short-term support but lingering medium- and long-term selling pressure, with the MA-50 versus MA-200 alignment confirming a bearish stance for the broader trend. Current support is seen at the 20-day moving average ($10.49), with near-term resistance at today's high ($10.86). Momentum indicators present a mixed outlook. MACD and the Average Directional Index (ADX) are both negative, signaling a loss of upward momentum and no clear trend strength at this time. The Relative Strength Index (RSI) at 54.2 tilts neutral with a buy forecast, but both Stochastic RSI (100) and Commodity Channel Index (CCI) at 109.96 are deep in overbought territory. Bull/Bear Power (BBP) is positive at 0.47, indicating buyers are currently in control, but the overbought readings suggest caution. The Awesome Oscillator is neutral, not reinforcing the current direction. The stock is trading at $10.58, down $0.34 or 3.11% on the day after a downside gap of $0.06 (gap pct -0.55%), with price sitting mid-range and intraday volatility at 4.22%. There is notable divergence among oscillators, with conflicting signals and profit-taking after early weakness dominating the intraday tone.
Earlier, analysts noted that Liberty Global was facing persistent downside risk due to sustained selling pressure and broadly bearish technical signals. The latest mixed momentum readings and ongoing struggle with overhead resistance suggest that traders should closely monitor the $11 level as a potential inflection point for a renewed directional move.






Latest Liberty Global News




-
 Afghanistan
-
 Albania
-
 Algeria
-
 Angola
-
 Argentina
-
 Armenia
-
 Australia
-
 Austria
-
 Azerbaijan
-
 Bahamas
-
 Bahrain
-
 Bangladesh
-
 Belarus
-
 Belgium
-
 Bolivia
-
 Botswana
-
 Brazil
-
 Brunei
-
 Bulgaria
-
 Cambodia
-
 Cameroon
-
 Canada
-
 Chile
-
 China
-
 Colombia
-
 Congo
-
 Costa Rica
-
 Cote d'Ivoire
-
 Croatia
-
 Cuba
-
 Cyprus
-
 Czechia
-
 DR Congo
-
 Denmark
-
 Dominican Republic
-
 Ecuador
-
 Egypt
-
 El Salvador
-
 Estonia
-
 Eswatini
-
 Ethiopia
-
 Finland
-
 France
-
 Georgia
-
 Germany
-
 Ghana
-
 Greece
-
 Haiti
-
 Hong Kong
-
 Hungary
-
 India
-
 Indonesia
-
 Iran, Islamic republic
-
 Iraq
-
 Ireland
-
 Israel
-
 Italy
-
 Jamaica
-
 Japan
-
 Jordan
-
 Kazakhstan
-
 Kenya
-
 Korea
-
 Kuwait
-
 Kyrgyzstan
-
 Laos
-
 Latvia
-
 Lebanon
-
 Lesotho
-
 Libya
-
 Lithuania
-
 Luxembourg
-
 Madagascar
-
 Malaysia
-
 Malta
-
 Mauritius
-
 Mexico
-
 Moldova
-
 Mongolia
-
 Montenegro
-
 Morocco
-
 Mozambique
-
 Myanmar
-
 Namibia
-
 Nepal
-
 Netherlands
-
 New Zealand
-
 Nigeria
-
 North Macedonia
-
 Norway
-
 Oman
-
 Pakistan
-
 Palestine
-
 Panama
-
 Papua New Guinea
-
 Paraguay
-
 Peru
-
 Philippines
-
 Poland
-
 Portugal
-
 Puerto Rico
-
 Qatar
-
 Reunion
-
 Romania
-
 Rwanda
-
 Saudi Arabia
-
 Serbia
-
 Singapore
-
 Slovakia
-
 Slovenia
-
 Somalia
-
 South Africa
-
 Spain
-
 Sri Lanka
-
 Sweden
-
 Switzerland
-
 Syria
-
 Taiwan
-
 Tajikistan
-
 Tanzania
-
 Thailand
-
 Trinidad and Tobago
-
 Tunisia
-
 Turkey
-
 UAE
-
 Uganda
-
 Ukraine
-
 United Kingdom
-
United States
-
 Uruguay
-
 Uzbekistan
-
 Venezuela
-
 Vietnam
-
 Yemen
-
 Zambia
-
 Zimbabwe
- Forex
- Crypto












