

Operational improvements strengthen cash generation: AEM resistance levels in focus

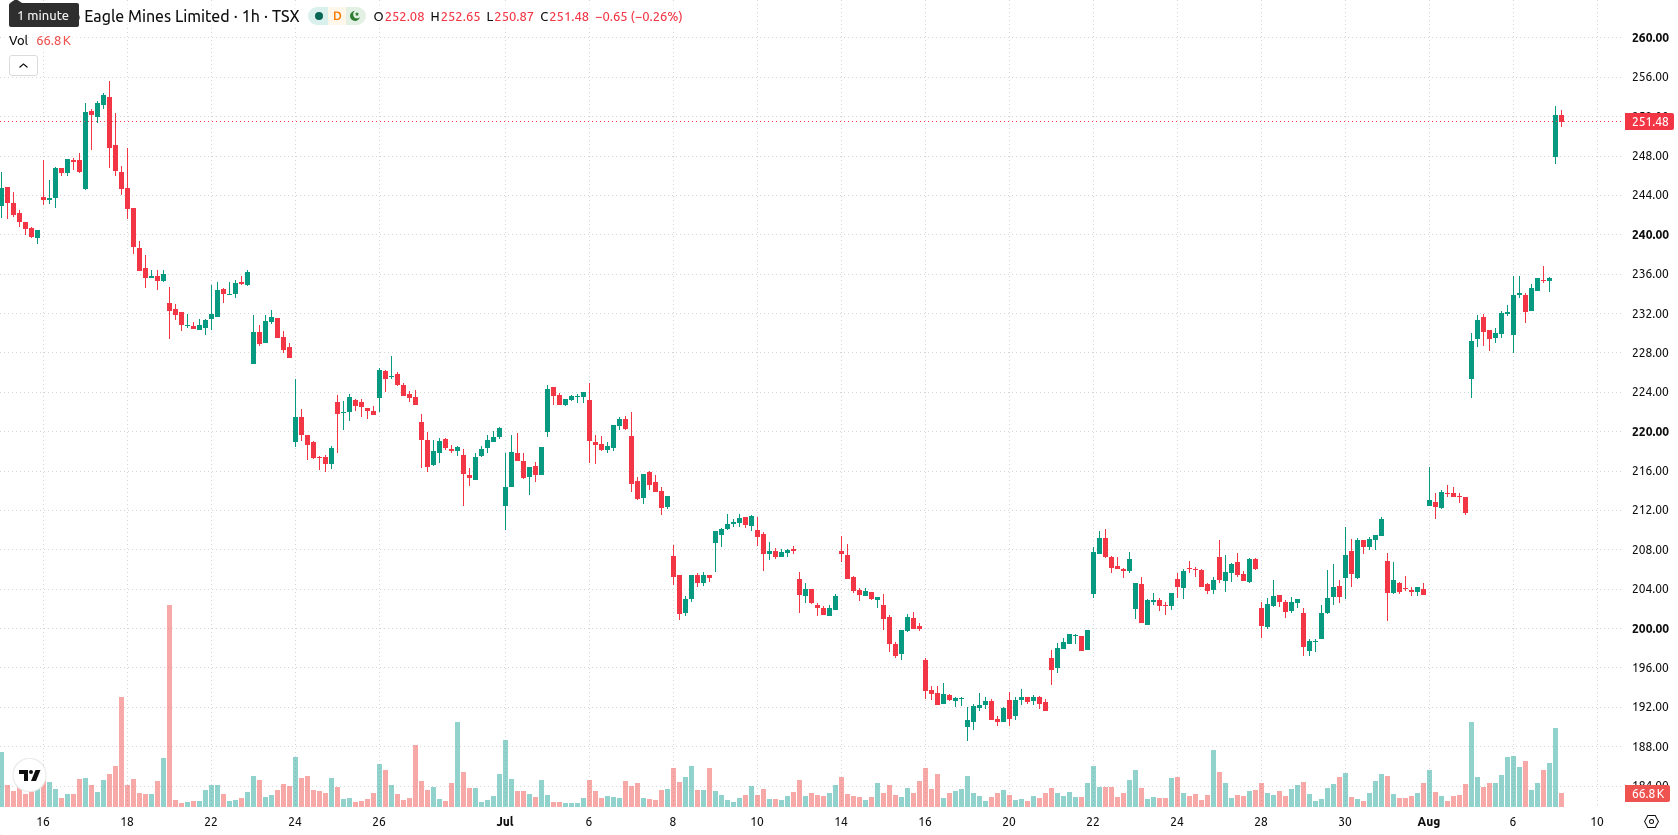
Agnico Eagle Mines (AEM) stock is trading at C$250.6, up 6.46% on the day. The price is positioned above its key moving averages, indicating ongoing short- and medium-term momentum.
 257.49
285.34
Highlights
- Agnico Eagle Mines has improved liquidity and financial resilience by maintaining disciplined operational practices that enhance cash flow.
- Rising gold prices are immediately boosting revenues and profit margins, supporting sector momentum and increasing investor demand for shares.
- Shares of Agnico Eagle Mines show robust short- and medium-term momentum with price expected to move within C$239.17 to C$262.03, though overbought conditions raise risk of near-term pullback.
Improved liquidity and sector momentum drive session’s share demand
Agnico Eagle Mines has strengthened its cash generation by maintaining disciplined operational practices, which directly improves its liquidity position and financial resilience, according to Kalkinemedia. This enhanced cash flow allows the company greater flexibility to exploit opportunities during periods of favorable market conditions. In addition, higher gold prices have provided an immediate boost to revenues and margins, further supporting sector-wide momentum in Canada’s mining industry. These factors together have underpinned demand for the shares in the current session.
Overbought momentum and resistance highlight risks amid bullish trend
The C$250.6 level places AEM above its MA-20 and MA-50, while it remains just below the MA-200, highlighting an area of longer-term resistance. The Ichimoku Kijun level at C$228.09 is the first key support zone. Momentum indicators remain strong: MACD and ADX are both presenting Buy signals, while the RSI stands at a notably high 86.77. Stochastic RSI, CCI, and Bull/Bear Power all reflect overbought conditions and strong buyer presence, with the Awesome Oscillator aligning with this bullish momentum. Such stretched oscillator readings suggest growing risks of a near-term pullback despite ongoing strength.
Consolidation scenario expected as volatility range limits near-term moves
AEM is likely to trade within a volatility band of C$239.17 to C$262.03 over the next few days. The baseline scenario favors sideways consolidation within this range, with a 76% probability of further gains and a 24% chance of a retracement. Sustained upward movement could resume if resistance is cleared, opening the door to additional rallies, while a break below the immediate Ichimoku Kijun support would increase the risk of corrective pressure.
Earlier, analysts noted that Agnico Eagle Mines displayed strong short- and medium-term momentum, though caution was warranted due to overbought conditions near long-term resistance. The current technical and fundamental backdrop reinforces this view, with traders advised to monitor for a potential breakout above the 200-day moving average as a signal for resumption of the uptrend.










-
 Afghanistan
-
 Albania
-
 Algeria
-
 Angola
-
 Argentina
-
 Armenia
-
 Australia
-
 Austria
-
 Azerbaijan
-
 Bahamas
-
 Bahrain
-
 Bangladesh
-
 Belarus
-
 Belgium
-
 Bolivia
-
 Botswana
-
 Brazil
-
 Brunei
-
 Bulgaria
-
 Cambodia
-
 Cameroon
-
 Canada
-
 Chile
-
 China
-
 Colombia
-
 Congo
-
 Costa Rica
-
 Cote d'Ivoire
-
 Croatia
-
 Cuba
-
 Cyprus
-
 Czechia
-
 DR Congo
-
 Denmark
-
 Dominican Republic
-
 Ecuador
-
 Egypt
-
 El Salvador
-
 Estonia
-
 Eswatini
-
 Ethiopia
-
 Finland
-
 France
-
 Georgia
-
 Germany
-
 Ghana
-
 Greece
-
 Haiti
-
 Hong Kong
-
 Hungary
-
 India
-
 Indonesia
-
 Iran, Islamic republic
-
 Iraq
-
 Ireland
-
 Israel
-
 Italy
-
 Jamaica
-
 Japan
-
 Jordan
-
 Kazakhstan
-
 Kenya
-
 Korea
-
 Kuwait
-
 Kyrgyzstan
-
 Laos
-
 Latvia
-
 Lebanon
-
 Lesotho
-
 Libya
-
 Lithuania
-
 Luxembourg
-
 Madagascar
-
 Malaysia
-
 Malta
-
 Mauritius
-
 Mexico
-
 Moldova
-
 Mongolia
-
 Montenegro
-
 Morocco
-
 Mozambique
-
 Myanmar
-
 Namibia
-
 Nepal
-
 Netherlands
-
 New Zealand
-
 Nigeria
-
 North Macedonia
-
 Norway
-
 Oman
-
 Pakistan
-
 Palestine
-
 Panama
-
 Papua New Guinea
-
 Paraguay
-
 Peru
-
 Philippines
-
 Poland
-
 Portugal
-
 Puerto Rico
-
 Qatar
-
 Reunion
-
 Romania
-
 Rwanda
-
 Saudi Arabia
-
 Serbia
-
 Singapore
-
 Slovakia
-
 Slovenia
-
 Somalia
-
 South Africa
-
 Spain
-
 Sri Lanka
-
 Sweden
-
 Switzerland
-
 Syria
-
 Taiwan
-
 Tajikistan
-
 Tanzania
-
 Thailand
-
 Trinidad and Tobago
-
 Tunisia
-
 Turkey
-
 UAE
-
 Uganda
-
 Ukraine
-
 United Kingdom
-
United States
-
 Uruguay
-
 Uzbekistan
-
 Venezuela
-
 Vietnam
-
 Yemen
-
 Zambia
-
 Zimbabwe
- Forex
- Crypto












