

Reckitt Benckiser shares technical analysis: Failed breakout at GBX5,340 resistance

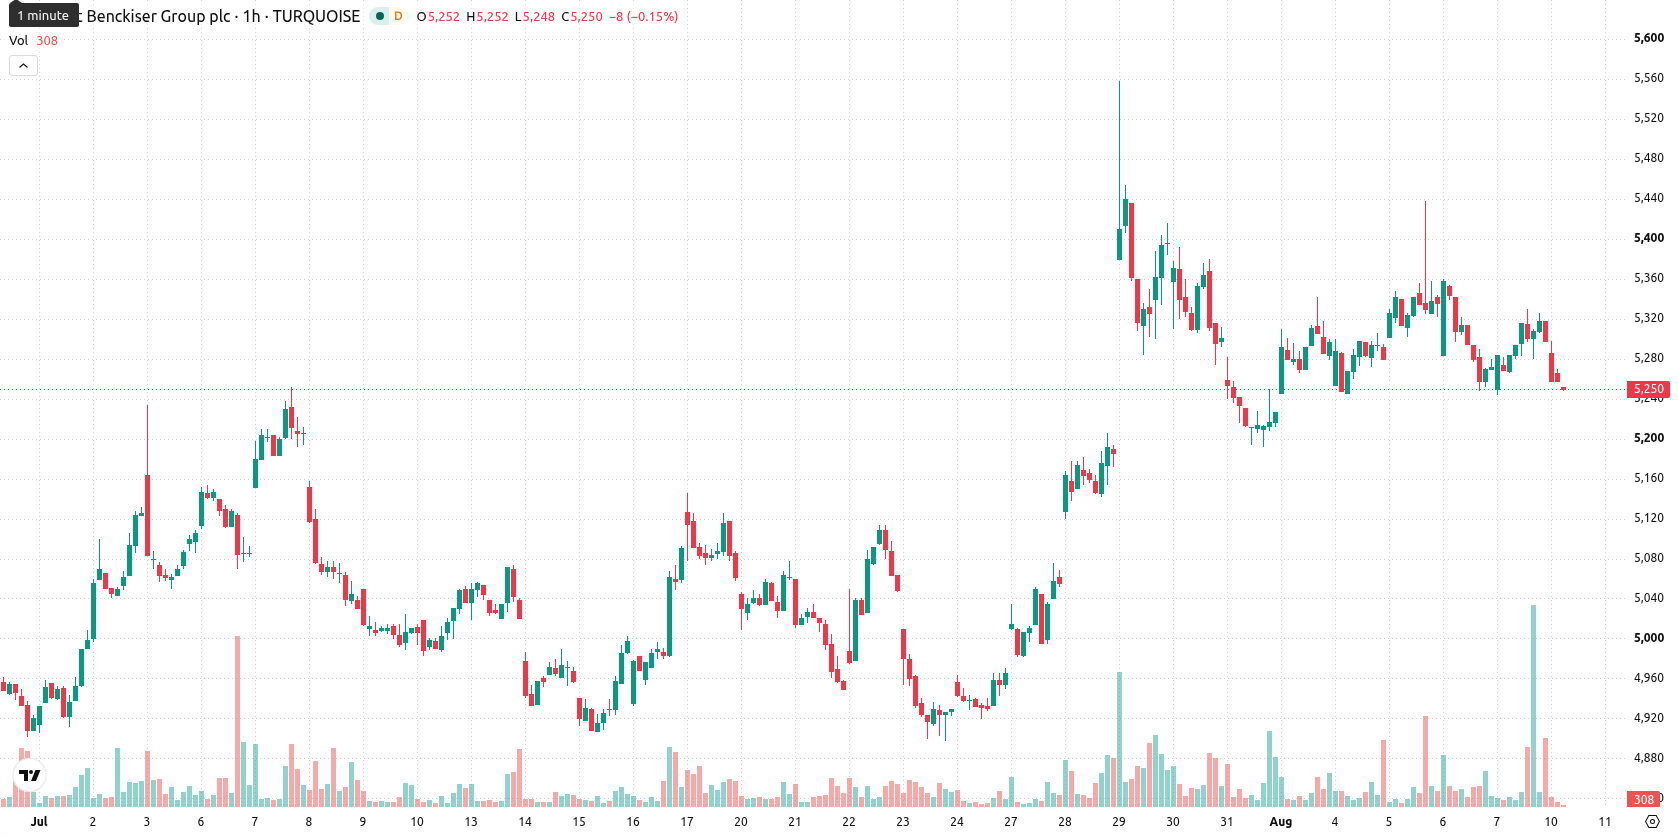
Reckitt Benckiser (RKT) stock is trading at GBX5,254, recording a modest slip for the session. The stock is currently positioned below its key moving averages.
 5718.00
5750.00
Highlights
- RKT/GBX stock trades below key short-, medium-, and long-term moving averages, confirming sustained bearish momentum.
- Momentum indicators, including MACD and RSI, signal continued selling pressure with no significant bullish divergence detected.
- Price is expected to fluctuate within a GBX5,166 to GBX5,341 range, with a higher probability of further downside unless immediate resistance is broken.
Bearish momentum builds as intraday indicators confirm resistance
On the hourly chart, RKT is trading below its MA-20 at GBX5,287 and MA-50 at GBX5,297, while also remaining well under the daily MA-200 at GBX5,524. The Ichimoku Kijun is positioned at GBX5,340 and marks immediate resistance. Momentum indicators reflect a weak setup, with MACD on a Sell signal, ADX Neutral, RSI at 42.83 (Sell), CCI flashing Sell, and Stoch RSI holding Neutral. Bull/Bear Power indicates sellers remain dominant on intraday momentum, and the Awesome Oscillator confirms the prevailing downtrend. The price is near today's low at GBX5,254, after a minor gap down of -10, and continues to experience low intraday volatility.
Downside risk rises as sideways action dominates near term
RKT is expected to move within the GBX5,166 to GBX5,341 range over the next several sessions, with sideways drift as the baseline scenario. The likelihood of an upward break is estimated at 25%, while a downward move is notably more probable. A decisive upside scenario would require a close above immediate resistance, while any sustained dip below support may accelerate downside pressure.
Earlier, analysts noted that Reckitt Benckiser's underlying trend remained cautious due to persistent technical weakness and limited upside signals. The current price action and momentum indicators reinforce this cautious stance, with close attention warranted on whether the stock can hold above the support zone or risks further downside.











-
 Afghanistan
-
 Albania
-
 Algeria
-
 Angola
-
 Argentina
-
 Armenia
-
 Australia
-
 Austria
-
 Azerbaijan
-
 Bahamas
-
 Bahrain
-
 Bangladesh
-
 Belarus
-
 Belgium
-
 Bolivia
-
 Botswana
-
 Brazil
-
 Brunei
-
 Bulgaria
-
 Cambodia
-
 Cameroon
-
 Canada
-
 Chile
-
 China
-
 Colombia
-
 Congo
-
 Costa Rica
-
 Cote d'Ivoire
-
 Croatia
-
 Cuba
-
 Cyprus
-
 Czechia
-
 DR Congo
-
 Denmark
-
 Dominican Republic
-
 Ecuador
-
 Egypt
-
 El Salvador
-
 Estonia
-
 Eswatini
-
 Ethiopia
-
 Finland
-
 France
-
 Georgia
-
 Germany
-
 Ghana
-
 Greece
-
 Haiti
-
 Hong Kong
-
 Hungary
-
 India
-
 Indonesia
-
 Iran, Islamic republic
-
 Iraq
-
 Ireland
-
 Israel
-
 Italy
-
 Jamaica
-
 Japan
-
 Jordan
-
 Kazakhstan
-
 Kenya
-
 Korea
-
 Kuwait
-
 Kyrgyzstan
-
 Laos
-
 Latvia
-
 Lebanon
-
 Lesotho
-
 Libya
-
 Lithuania
-
 Luxembourg
-
 Madagascar
-
 Malaysia
-
 Malta
-
 Mauritius
-
 Mexico
-
 Moldova
-
 Mongolia
-
 Montenegro
-
 Morocco
-
 Mozambique
-
 Myanmar
-
 Namibia
-
 Nepal
-
 Netherlands
-
 New Zealand
-
 Nigeria
-
 North Macedonia
-
 Norway
-
 Oman
-
 Pakistan
-
 Palestine
-
 Panama
-
 Papua New Guinea
-
 Paraguay
-
 Peru
-
 Philippines
-
 Poland
-
 Portugal
-
 Puerto Rico
-
 Qatar
-
 Reunion
-
 Romania
-
 Rwanda
-
 Saudi Arabia
-
 Serbia
-
 Singapore
-
 Slovakia
-
 Slovenia
-
 Somalia
-
 South Africa
-
 Spain
-
 Sri Lanka
-
 Sweden
-
 Switzerland
-
 Syria
-
 Taiwan
-
 Tajikistan
-
 Tanzania
-
 Thailand
-
 Trinidad and Tobago
-
 Tunisia
-
 Turkey
-
 UAE
-
 Uganda
-
 Ukraine
-
 United Kingdom
-
United States
-
 Uruguay
-
 Uzbekistan
-
 Venezuela
-
 Vietnam
-
 Yemen
-
 Zambia
-
 Zimbabwe
- Forex
- Crypto












