

Consolidation below resistance defines Morgan Stanley stock: recovery holds but faces a stretched setup weekly forecast

Shares of Morgan Stanley (MS) are trading near $217 as a stretch in the recent recovery setup leaves the stock consolidating just under resistance. With the move over the past week remaining muted, attention turns to whether this holding pattern persists given the ongoing product launches and governance headlines.
 186.08
192.90
Highlights
- Shares of Morgan Stanley edge higher to $216.7, consolidating around key moving averages in a bullish long-term pattern.
- Daily price action is confined in a narrow range with mixed momentum oscillators, indicating neutral short-term direction and exhaustion near peaks.
- Stock is likely to consolidate between $215.86 support and $217.6 resistance, with the broader trading range set at $208.26 to $224.29.
ETF launches and governance scrutiny guide sentiment over the week
Morgan Stanley drew attention after launching new spot Ethereum and Solana ETFs and enabling select clients to trade bitcoin, solana, and ether through its E*Trade platform, according to The Daily Upside. The bank also reported $114.74 billion in annual revenue and $16.25 billion in profit for the year, while Yahoo Finance noted the stock may now be moderately overvalued following these ETF launches. Simply Wall St reported renewed scrutiny on governance practices as the bank continues its share repurchases and bond issuances.
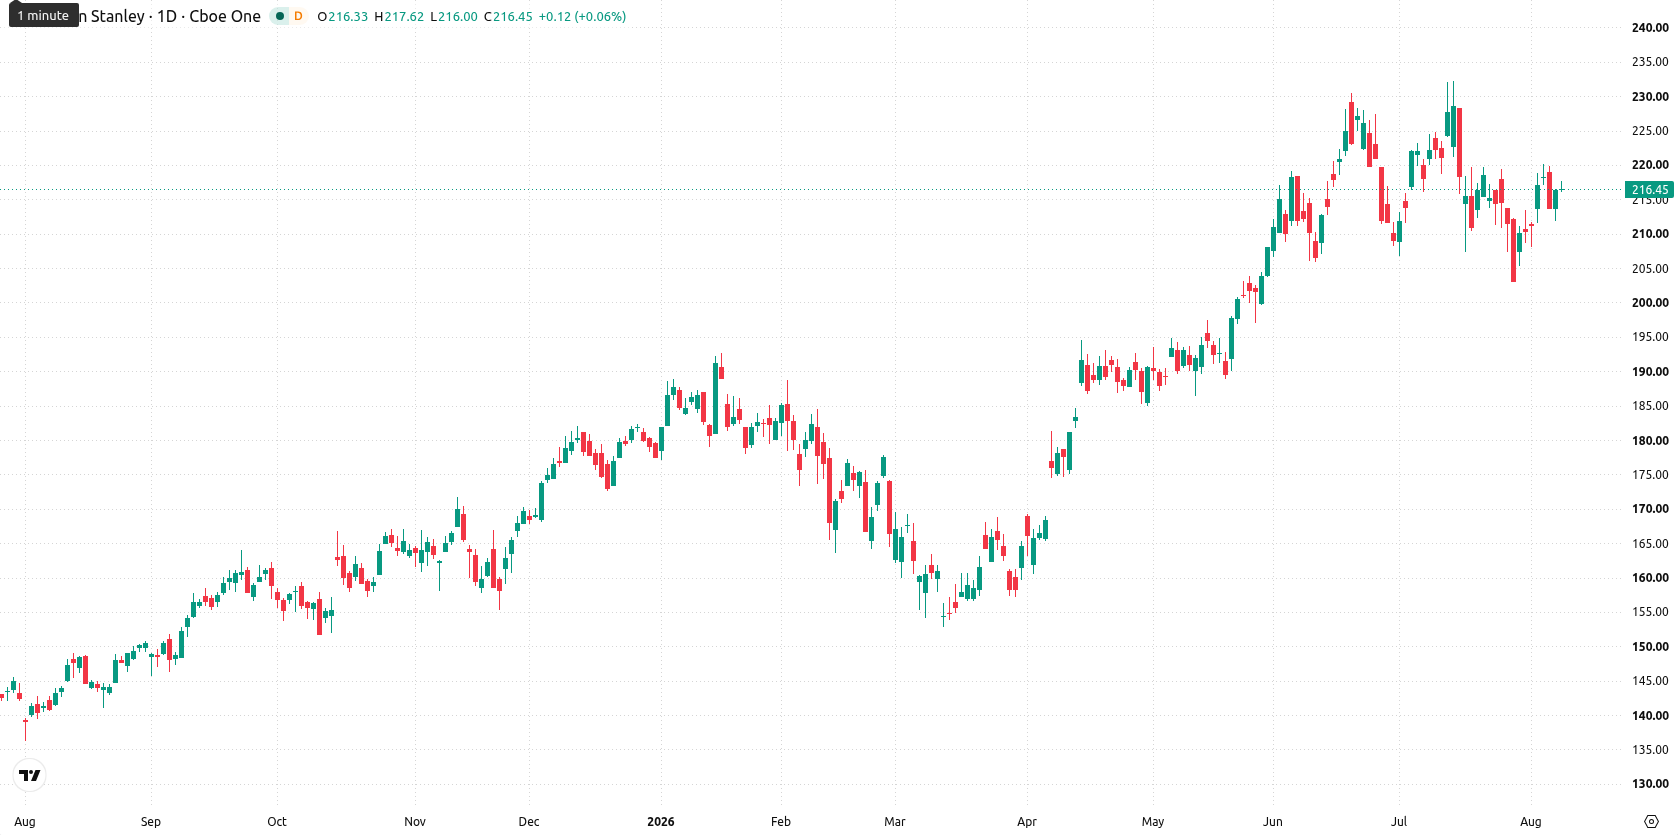
Technical consolidation persists as mixed indicators constrain direction
The daily chart structure shows consolidation, with momentum characterized by a contained move within a narrow range and 7-day volatility at 4.07%. Oscillators are mixed, as RSI at 51.77 sits in neutral while Stochastic RSI shows an overbought reading at 86.12, indicating exhaustion near short-term peaks. The nearest support is at $215.86 from the MA-50, with resistance at $217.6 marked by the Ichimoku Kijun. This setup suggests the stock is pinned between key technical levels, with no clear trend direction.
Probable upward bias this week amid tightly defined support and resistance
Over the coming trading week, the stock is expected to operate between $208.26 and $224.29. There is a very high probability of an increase and a very low probability of a decrease. The base case is for Morgan Stanley to consolidate between $215.86 support and $217.6 resistance. A break above $217.6 could open a challenge toward the top of the expected range, while a move below support at $215.86 may see shares drift toward the $208.26 lower bound.
Earlier, analysts noted that Morgan Stanley's launch of its Ethereum Trust supported a generally bullish technical outlook for the stock. The current article expands on this by highlighting the impact of new ETF launches and trading platform access, suggesting that close monitoring of the $217.6 resistance level is warranted as the next major inflection point for near-term price direction.










-
 Afghanistan
-
 Albania
-
 Algeria
-
 Angola
-
 Argentina
-
 Armenia
-
 Australia
-
 Austria
-
 Azerbaijan
-
 Bahamas
-
 Bahrain
-
 Bangladesh
-
 Belarus
-
 Belgium
-
 Bolivia
-
 Botswana
-
 Brazil
-
 Brunei
-
 Bulgaria
-
 Cambodia
-
 Cameroon
-
 Canada
-
 Chile
-
 China
-
 Colombia
-
 Congo
-
 Costa Rica
-
 Cote d'Ivoire
-
 Croatia
-
 Cuba
-
 Cyprus
-
 Czechia
-
 DR Congo
-
 Denmark
-
 Dominican Republic
-
 Ecuador
-
 Egypt
-
 El Salvador
-
 Estonia
-
 Eswatini
-
 Ethiopia
-
 Finland
-
 France
-
 Georgia
-
 Germany
-
 Ghana
-
 Greece
-
 Haiti
-
 Hong Kong
-
 Hungary
-
 India
-
 Indonesia
-
 Iran, Islamic republic
-
 Iraq
-
 Ireland
-
 Israel
-
 Italy
-
 Jamaica
-
 Japan
-
 Jordan
-
 Kazakhstan
-
 Kenya
-
 Korea
-
 Kuwait
-
 Kyrgyzstan
-
 Laos
-
 Latvia
-
 Lebanon
-
 Lesotho
-
 Libya
-
 Lithuania
-
 Luxembourg
-
 Madagascar
-
 Malaysia
-
 Malta
-
 Mauritius
-
 Mexico
-
 Moldova
-
 Mongolia
-
 Montenegro
-
 Morocco
-
 Mozambique
-
 Myanmar
-
 Namibia
-
 Nepal
-
 Netherlands
-
 New Zealand
-
 Nigeria
-
 North Macedonia
-
 Norway
-
 Oman
-
 Pakistan
-
 Palestine
-
 Panama
-
 Papua New Guinea
-
 Paraguay
-
 Peru
-
 Philippines
-
 Poland
-
 Portugal
-
 Puerto Rico
-
 Qatar
-
 Reunion
-
 Romania
-
 Rwanda
-
 Saudi Arabia
-
 Serbia
-
 Singapore
-
 Slovakia
-
 Slovenia
-
 Somalia
-
 South Africa
-
 Spain
-
 Sri Lanka
-
 Sweden
-
 Switzerland
-
 Syria
-
 Taiwan
-
 Tajikistan
-
 Tanzania
-
 Thailand
-
 Trinidad and Tobago
-
 Tunisia
-
 Turkey
-
 UAE
-
 Uganda
-
 Ukraine
-
 United Kingdom
-
United States
-
 Uruguay
-
 Uzbekistan
-
 Venezuela
-
 Vietnam
-
 Yemen
-
 Zambia
-
 Zimbabwe
- Forex
- Crypto












