

What's behind Bit Digital's latest 4.0% stock pullback?

Bit Digital Inc (BTBT) slid 3.99% as traders braced for the company's upcoming quarterly financial report, renewing pressure on the stock. The move is reinforced by ongoing technical weakness, with BTBT remaining below all key short-, medium-, and long-term moving averages.
 0.7549
0.8749
Highlights
- Bit Digital will report quarterly results this week after earlier quarters showed financial strain and subsequent second-quarter recovery of about 37%.
- Despite the recent rebound, shares remain under broad selling pressure and have not reclaimed prior strength.
- The stock trades below key averages with bearish momentum dominating, and the expected five-day range is $1.27 to $1.37, skewed to the downside.
Quarterly report timing weighs on sentiment amid fragile recovery
Bit Digital is scheduled to release its quarterly financial report this week. Recent results showed financial pressure in earlier quarters. The company recorded a recovery of approximately 37% during the second quarter, though price action has remained under broader selling pressure.
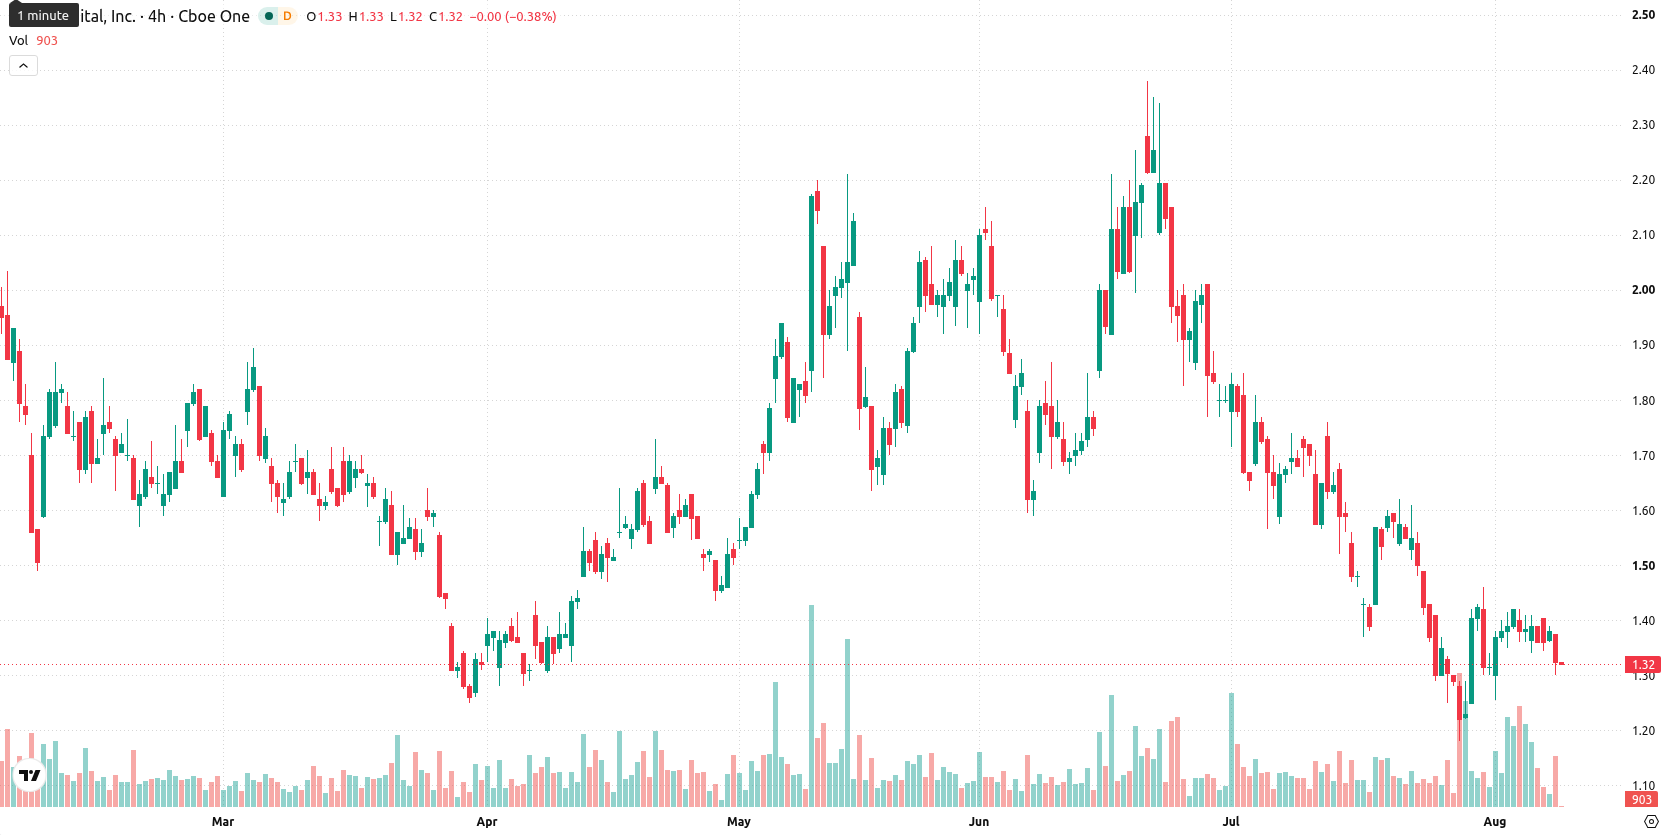
Price sinks below moving averages as technical signals remain bearish
BTBT is trading below its 20-day ($1.44), 50-day ($1.70), and 200-day ($1.97) moving averages, signaling persistent downward pressure across all major timeframes. Immediate resistance is at $1.34, with near-term support at $1.31, and the overall trend context remains bearish. Momentum indicators highlight continued weakness: the MACD issues a Strong Sell signal, the ADX is neutral, and the RSI at 42.7 is in sell territory. The Commodity Channel Index is neutral, Stochastic RSI appears overbought indicating recent gains may reverse, and Bull/Bear Power points to intraday dominance by sellers. Price action is hovering near session lows with intraday volatility at 5.34%, matching the prevailing bearish momentum.
Earlier, analysts noted that Bit Digital’s technical outlook remained decidedly bearish, with persistent weakness and little evidence of sustained upward momentum. The current analysis reinforces this negative bias, highlighting $1.34 as a key resistance level while a decisive break below $1.31 could open the door for further downside in the near term.






Latest Bit Digital News



-
 Afghanistan
-
 Albania
-
 Algeria
-
 Angola
-
 Argentina
-
 Armenia
-
 Australia
-
 Austria
-
 Azerbaijan
-
 Bahamas
-
 Bahrain
-
 Bangladesh
-
 Belarus
-
 Belgium
-
 Bolivia
-
 Botswana
-
 Brazil
-
 Brunei
-
 Bulgaria
-
 Cambodia
-
 Cameroon
-
 Canada
-
 Chile
-
 China
-
 Colombia
-
 Congo
-
 Costa Rica
-
 Cote d'Ivoire
-
 Croatia
-
 Cuba
-
 Cyprus
-
 Czechia
-
 DR Congo
-
 Denmark
-
 Dominican Republic
-
 Ecuador
-
 Egypt
-
 El Salvador
-
 Estonia
-
 Eswatini
-
 Ethiopia
-
 Finland
-
 France
-
 Georgia
-
 Germany
-
 Ghana
-
 Greece
-
 Haiti
-
 Hong Kong
-
 Hungary
-
 India
-
 Indonesia
-
 Iran, Islamic republic
-
 Iraq
-
 Ireland
-
 Israel
-
 Italy
-
 Jamaica
-
 Japan
-
 Jordan
-
 Kazakhstan
-
 Kenya
-
 Korea
-
 Kuwait
-
 Kyrgyzstan
-
 Laos
-
 Latvia
-
 Lebanon
-
 Lesotho
-
 Libya
-
 Lithuania
-
 Luxembourg
-
 Madagascar
-
 Malaysia
-
 Malta
-
 Mauritius
-
 Mexico
-
 Moldova
-
 Mongolia
-
 Montenegro
-
 Morocco
-
 Mozambique
-
 Myanmar
-
 Namibia
-
 Nepal
-
 Netherlands
-
 New Zealand
-
 Nigeria
-
 North Macedonia
-
 Norway
-
 Oman
-
 Pakistan
-
 Palestine
-
 Panama
-
 Papua New Guinea
-
 Paraguay
-
 Peru
-
 Philippines
-
 Poland
-
 Portugal
-
 Puerto Rico
-
 Qatar
-
 Reunion
-
 Romania
-
 Rwanda
-
 Saudi Arabia
-
 Serbia
-
 Singapore
-
 Slovakia
-
 Slovenia
-
 Somalia
-
 South Africa
-
 Spain
-
 Sri Lanka
-
 Sweden
-
 Switzerland
-
 Syria
-
 Taiwan
-
 Tajikistan
-
 Tanzania
-
 Thailand
-
 Trinidad and Tobago
-
 Tunisia
-
 Turkey
-
 UAE
-
 Uganda
-
 Ukraine
-
 United Kingdom
-
United States
-
 Uruguay
-
 Uzbekistan
-
 Venezuela
-
 Vietnam
-
 Yemen
-
 Zambia
-
 Zimbabwe
- Forex
- Crypto












