


Nutanix, Inc. (NTNX) surged 3.17% higher on strong upside momentum and bullish technical structure, as clear buying pressure drove the advance in the absence of a fresh news catalyst. The quality of today's move is supported by decisive trend strength above all major moving averages, but overbought signals now point to an increased risk of short-term exhaustion.
 67.53
74.09
Highlights
- Nutanix stock is in a strong bullish trend, trading above key short-, medium-, and long-term moving averages.
- Momentum indicators confirm sustained buyer strength, although overbought signals suggest a risk of short-term pullback.
- Shares are expected to consolidate between $62.69 and $66.63 over five days, with a high probability of further upside if $64.82 is breached.
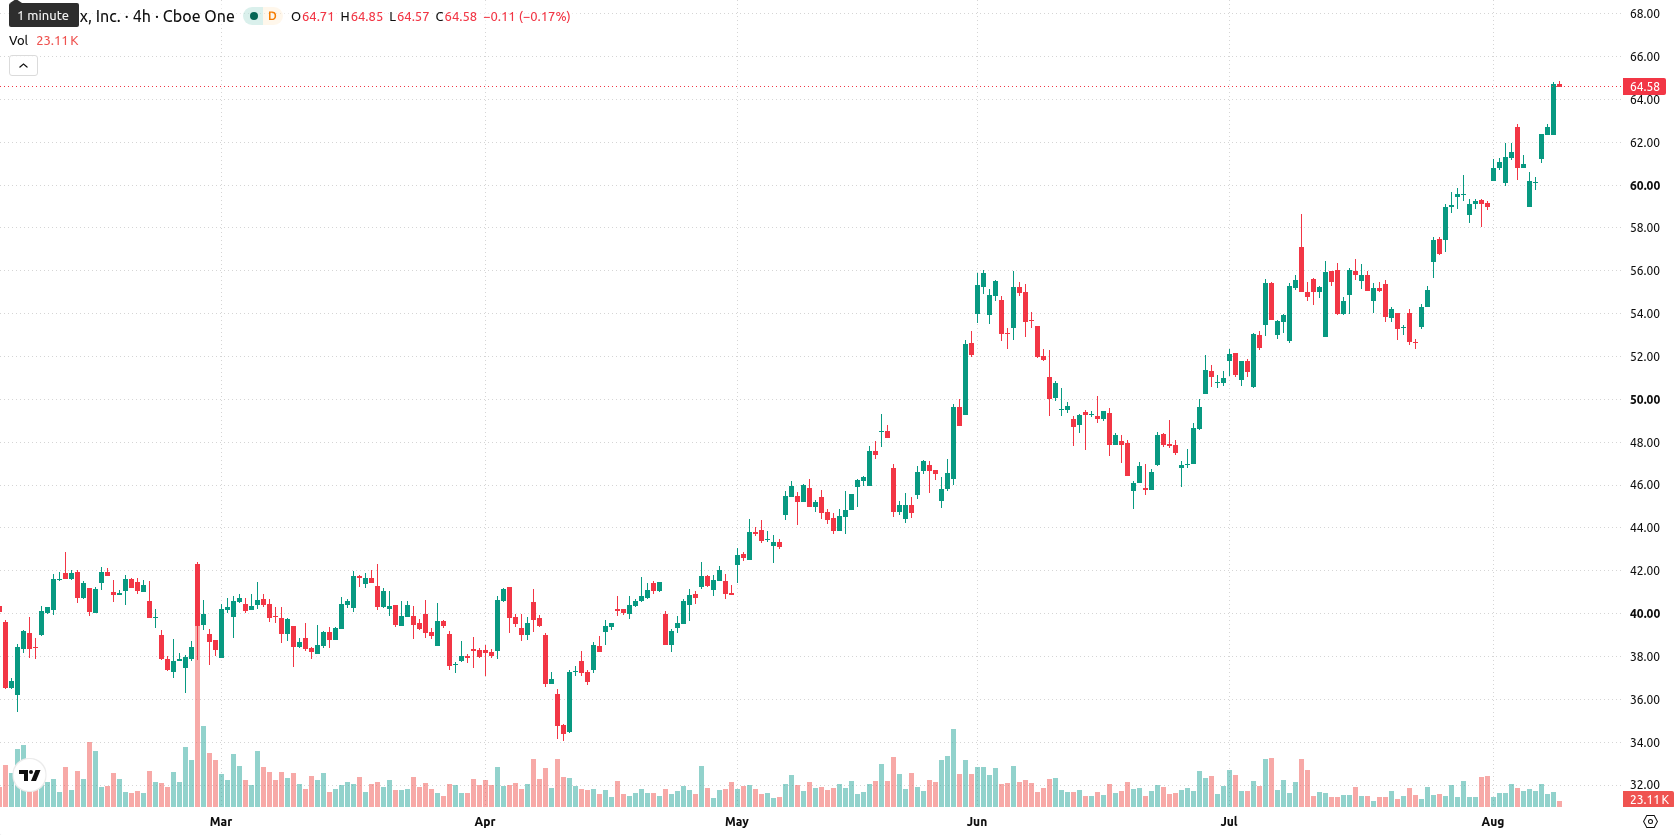
Momentum signals align with strong uptrend but overbought risk grows
Nutanix is trading above the 20-day ($57.33), 50-day ($53.52), and 200-day ($49.07) moving averages, confirming a strong short-, medium-, and long-term bullish trend. The near-term ceiling is set at $64.82, while the nearest floor sits at $62.98, reinforcing the prevailing positive structure with additional confirmation from the Ichimoku Kijun at $56.72. Momentum indicators remain strong as both the Moving Average Convergence Divergence (MACD) and Average Directional Index (ADX) signal ongoing buyer strength. The Relative Strength Index (RSI) at 71.89, Stochastic RSI at 92.88, and Commodity Channel Index (CCI) at 124.11 all show overbought conditions. Bull/Bear Power (BBP) at 3.67 indicates buyers dominate intraday momentum and also warns of an overbought situation. The stock is currently priced at $64.66, up 3.17% or $1.99 for the session, after opening nearly flat. Price action is near the daily high, daily volatility stands at 3.60%, and intraday tone reflects strong directional conviction to the upside. Momentum and price action are aligned, but several oscillators highlight the risk of short-term overheating.
Earlier, analysts noted that Nutanix was demonstrating persistent bullish momentum underpinned by strong technical fundamentals, though short-term exhaustion risk was apparent. The present analysis reinforces this outlook and highlights that traders should closely monitor the $64.82 resistance, as a breakout could open the path for extended gains within the projected $62.69–$66.63 trading range.






Latest Nutanix News




-
 Afghanistan
-
 Albania
-
 Algeria
-
 Angola
-
 Argentina
-
 Armenia
-
 Australia
-
 Austria
-
 Azerbaijan
-
 Bahamas
-
 Bahrain
-
 Bangladesh
-
 Belarus
-
 Belgium
-
 Bolivia
-
 Botswana
-
 Brazil
-
 Brunei
-
 Bulgaria
-
 Cambodia
-
 Cameroon
-
 Canada
-
 Chile
-
 China
-
 Colombia
-
 Congo
-
 Costa Rica
-
 Cote d'Ivoire
-
 Croatia
-
 Cuba
-
 Cyprus
-
 Czechia
-
 DR Congo
-
 Denmark
-
 Dominican Republic
-
 Ecuador
-
 Egypt
-
 El Salvador
-
 Estonia
-
 Eswatini
-
 Ethiopia
-
 Finland
-
 France
-
 Georgia
-
 Germany
-
 Ghana
-
 Greece
-
 Haiti
-
 Hong Kong
-
 Hungary
-
 India
-
 Indonesia
-
 Iran, Islamic republic
-
 Iraq
-
 Ireland
-
 Israel
-
 Italy
-
 Jamaica
-
 Japan
-
 Jordan
-
 Kazakhstan
-
 Kenya
-
 Korea
-
 Kuwait
-
 Kyrgyzstan
-
 Laos
-
 Latvia
-
 Lebanon
-
 Lesotho
-
 Libya
-
 Lithuania
-
 Luxembourg
-
 Madagascar
-
 Malaysia
-
 Malta
-
 Mauritius
-
 Mexico
-
 Moldova
-
 Mongolia
-
 Montenegro
-
 Morocco
-
 Mozambique
-
 Myanmar
-
 Namibia
-
 Nepal
-
 Netherlands
-
 New Zealand
-
 Nigeria
-
 North Macedonia
-
 Norway
-
 Oman
-
 Pakistan
-
 Palestine
-
 Panama
-
 Papua New Guinea
-
 Paraguay
-
 Peru
-
 Philippines
-
 Poland
-
 Portugal
-
 Puerto Rico
-
 Qatar
-
 Reunion
-
 Romania
-
 Rwanda
-
 Saudi Arabia
-
 Serbia
-
 Singapore
-
 Slovakia
-
 Slovenia
-
 Somalia
-
 South Africa
-
 Spain
-
 Sri Lanka
-
 Sweden
-
 Switzerland
-
 Syria
-
 Taiwan
-
 Tajikistan
-
 Tanzania
-
 Thailand
-
 Trinidad and Tobago
-
 Tunisia
-
 Turkey
-
 UAE
-
 Uganda
-
 Ukraine
-
 United Kingdom
-
United States
-
 Uruguay
-
 Uzbekistan
-
 Venezuela
-
 Vietnam
-
 Yemen
-
 Zambia
-
 Zimbabwe
- Forex
- Crypto












