


Nutanix, Inc. (NTNX) fell 3.72% today as persistent selling pressure dominated following recent earnings. The move is supported by Nutanix trading below its 20-day and 50-day moving averages, indicating continued short- and medium-term weakness.
 56.66
59.99
Highlights
- Nutanix reported earnings of $0.60 per share and $757.08 million in revenue, exceeding analyst expectations.
- The integration of Traefik Hub on the Nutanix Cloud Platform expands API gateway and security offerings for service providers.
- Shares of Nutanix closed at $55.12 after falling 3.72%, with broad selling pressure and persistent bearish technical signals; near-term trading is expected between $53.1 and $57.13.
Strong results and expansion met by broad-based selling pressure
Nutanix reported quarterly earnings of $0.60 per share and $757.08 million in revenue, surpassing analyst estimates. The company also integrated Traefik Hub on its Cloud Platform, expanding API gateway and security options for service providers. These developments were accompanied by broader selling pressure.
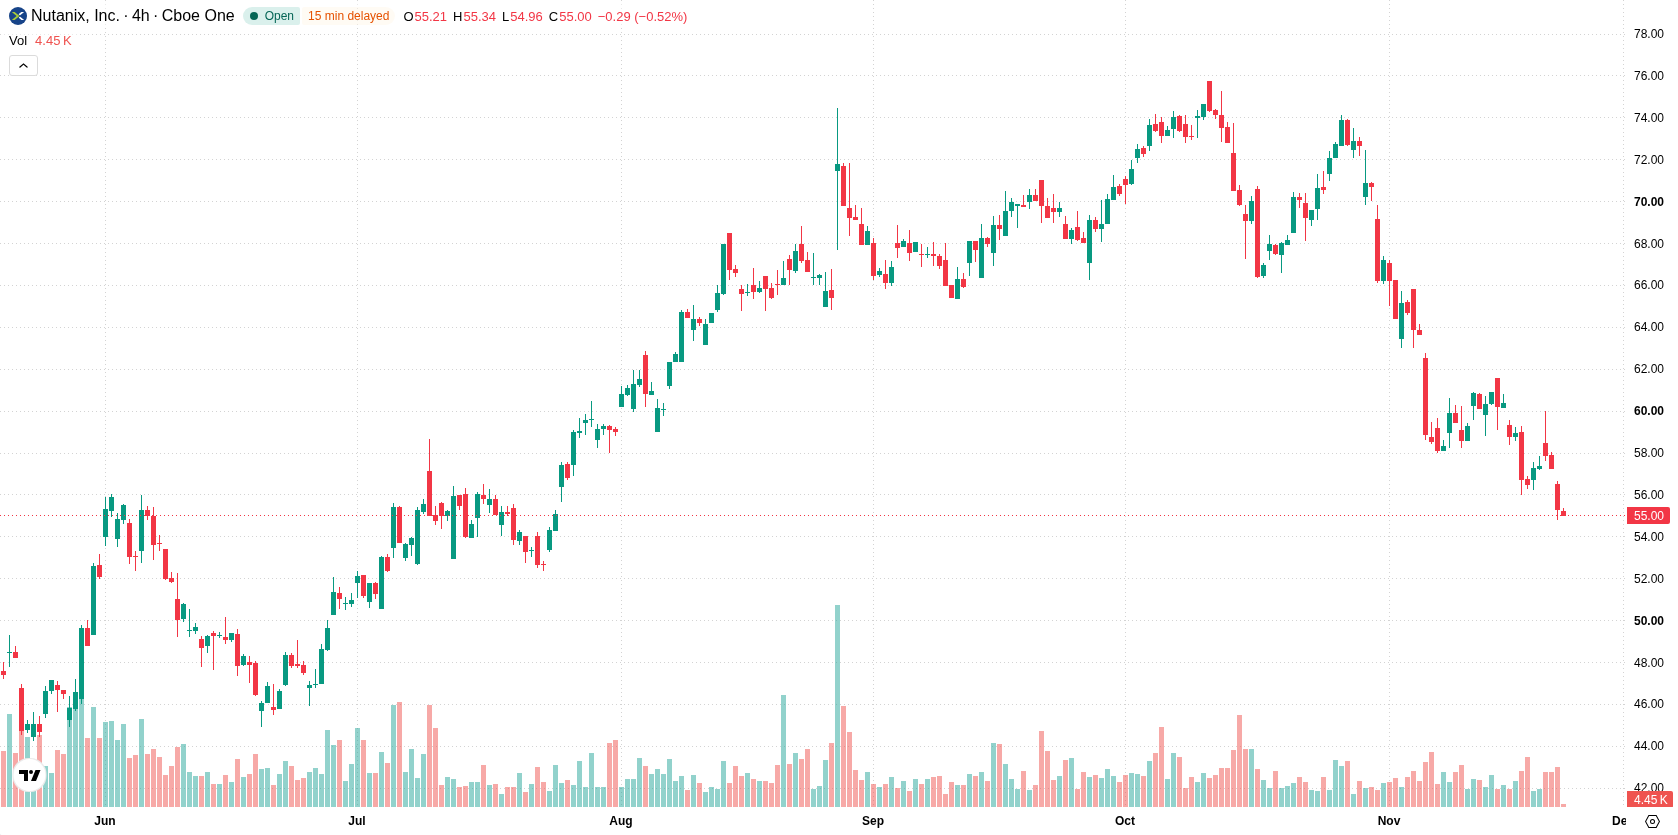
Persistent momentum loss as price nears major technical support
Nutanix is trading below its 20-day and 50-day moving averages at $63.32 and $67.46, which signals ongoing short- and medium-term pressure from sellers. However, the stock remains above its 200-day moving average of $53.71, suggesting some longer-term technical support. The Ichimoku Kijun at $65.01 marks distant overhead resistance, while the alignment of the MA-50 above the MA-200 maintains a bullish slant in the broader timeframe. Near-term resistance stands at $55.46, with support at $53.71. Momentum signals are negative overall, as the MACD and ADX highlight persistent selling momentum. The RSI, Stochastic RSI, and CCI are all neutral, showing no current overbought or oversold conditions. Bull/Bear Power suggests sellers control intraday action, in line with the direction of the Awesome Oscillator. The session exhibited clear selling pressure after the open, with price action near the day’s low and intraday volatility at 2.16%.
Earlier, analysts noted that Nutanix was experiencing persistent short- and medium-term technical weakness despite a fundamentally supportive backdrop. The latest price action and volatility projections reinforce this view, with traders advised to monitor $53.71 as a crucial support level for potential directional shifts.






Latest Nutanix News




-
 Afghanistan
-
 Albania
-
 Algeria
-
 Angola
-
 Argentina
-
 Armenia
-
 Australia
-
 Austria
-
 Azerbaijan
-
 Bahamas
-
 Bahrain
-
 Bangladesh
-
 Belarus
-
 Belgium
-
 Bolivia
-
 Botswana
-
 Brazil
-
 Brunei
-
 Bulgaria
-
 Cambodia
-
 Cameroon
-
 Canada
-
 Chile
-
 China
-
 Colombia
-
 Congo
-
 Costa Rica
-
 Cote d'Ivoire
-
 Croatia
-
 Cuba
-
 Cyprus
-
 Czechia
-
 DR Congo
-
 Denmark
-
 Dominican Republic
-
 Ecuador
-
 Egypt
-
 El Salvador
-
 Estonia
-
 Eswatini
-
 Ethiopia
-
 Finland
-
 France
-
 Georgia
-
 Germany
-
 Ghana
-
 Greece
-
 Haiti
-
 Hong Kong
-
 Hungary
-
 India
-
 Indonesia
-
 Iran, Islamic republic
-
 Iraq
-
 Ireland
-
 Israel
-
 Italy
-
 Jamaica
-
 Japan
-
 Jordan
-
 Kazakhstan
-
 Kenya
-
 Korea
-
 Kuwait
-
 Kyrgyzstan
-
 Laos
-
 Latvia
-
 Lebanon
-
 Lesotho
-
 Libya
-
 Lithuania
-
 Luxembourg
-
 Madagascar
-
 Malaysia
-
 Malta
-
 Mauritius
-
 Mexico
-
 Moldova
-
 Mongolia
-
 Montenegro
-
 Morocco
-
 Mozambique
-
 Myanmar
-
 Namibia
-
 Nepal
-
 Netherlands
-
 New Zealand
-
 Nigeria
-
 North Macedonia
-
 Norway
-
 Oman
-
 Pakistan
-
 Palestine
-
 Panama
-
 Papua New Guinea
-
 Paraguay
-
 Peru
-
 Philippines
-
 Poland
-
 Portugal
-
 Puerto Rico
-
 Qatar
-
 Reunion
-
 Romania
-
 Rwanda
-
 Saudi Arabia
-
 Serbia
-
 Singapore
-
 Slovakia
-
 Slovenia
-
 Somalia
-
 South Africa
-
 Spain
-
 Sri Lanka
-
 Sweden
-
 Switzerland
-
 Syria
-
 Taiwan
-
 Tajikistan
-
 Tanzania
-
 Thailand
-
 Trinidad and Tobago
-
 Tunisia
-
 Turkey
-
 UAE
-
 Uganda
-
 Ukraine
-
 United Kingdom
-
United States
-
 Uruguay
-
 Uzbekistan
-
 Venezuela
-
 Vietnam
-
 Yemen
-
 Zambia
-
 Zimbabwe
- Forex
- Crypto












