

Palantir shares technical analysis: Consolidation near $187.74 resistance

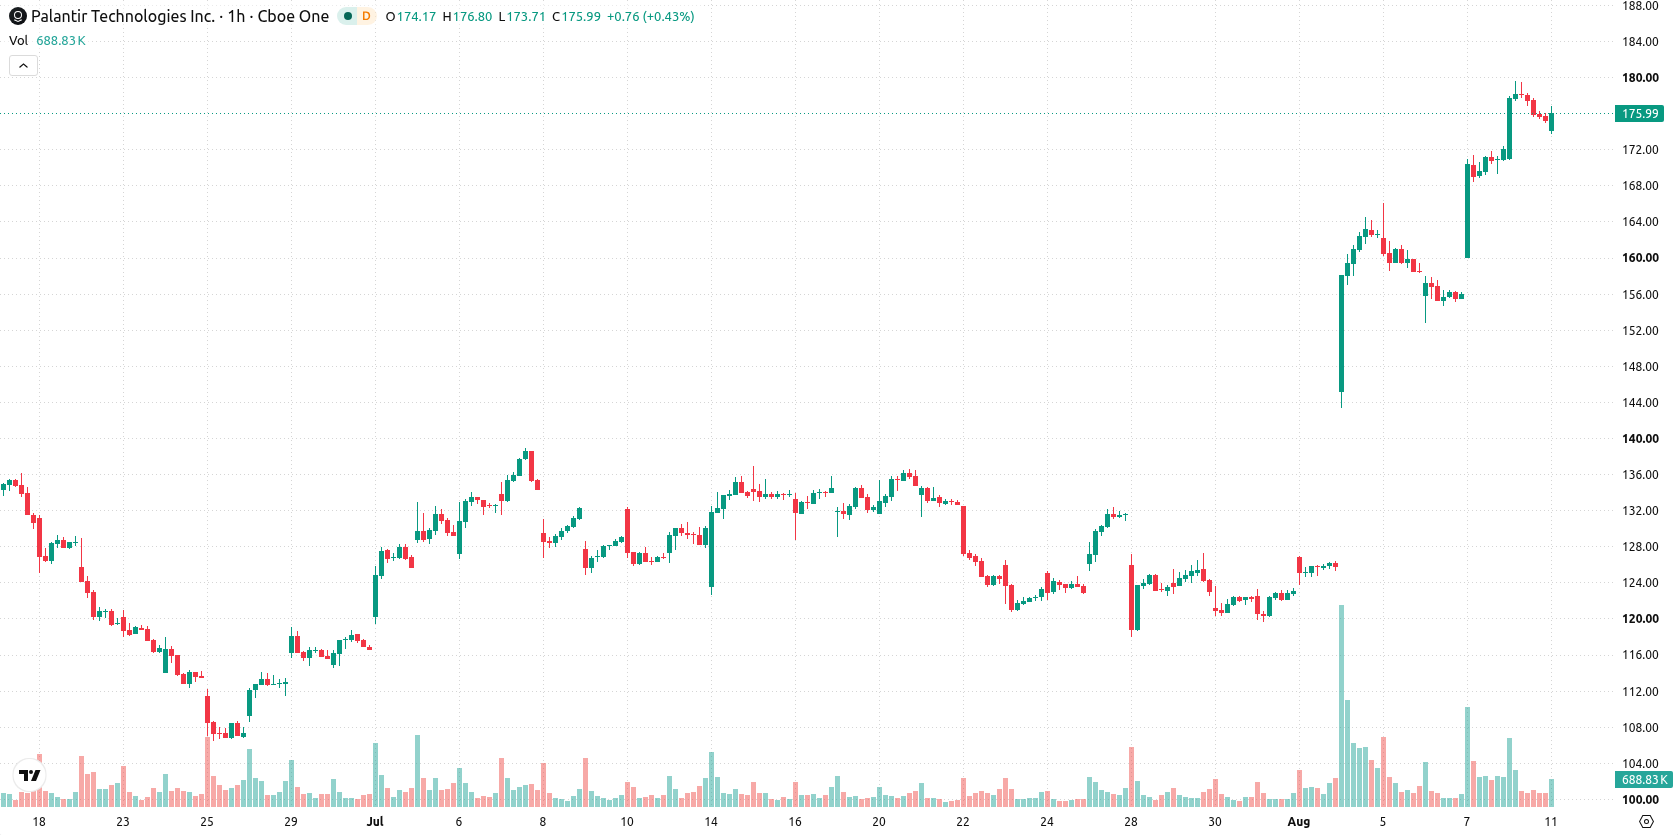
Palantir (PLTR) stock is trading at $175.72, marking a modest uptick intraday and sitting comfortably above its key short- and medium-term moving averages. The price remains mid-range, with moderate volatility prevailing as it holds above important technical thresholds.
 158.16
173.03
Highlights
- Palantir reported Q2 2026 revenue of $1.935 billion, a 93% year-over-year increase, demonstrating strong sales execution and demand.
- Quarterly operating margin reached 47% with net income at $1.062 billion and a $13.1 billion backlog supporting future growth.
- Shares of Palantir trade with bullish momentum; technicals project a high probability of price moving within $163.7 to $187.74 over the next two to three days.
Exceptional revenue surge as AI and defense demand expand
Palantir’s standout Q2 2026 results, with $1.935 billion in revenue marking a 93% year-over-year increase, highlight exceptional sales execution and heightened demand from both U.S. commercial clients and government contracts, according to Tradingkey. Profit metrics for the quarter were robust, with a 47% GAAP operating margin and net income of $1.062 billion, alongside a strong 155% Rule of 40 score, reinforcing confidence in the company’s operational efficiency. Supplementing this, Seekingalpha noted the company’s $13.1 billion backlog, while Fxleaders reported rapid adoption of Palantir’s Artificial Intelligence Platform and Simplywall indicated further expansion into military applications; collectively, these developments underpin the long-term outlook but arrive amid a session characterized by only modest price movement.
Strong buy signals amid overbought readings and mixed oscillator cues
PLTR is trading above the MA-20 at $169.14 and the MA-50 at $156.07 on the hourly chart, as well as above the MA-200 at $152.22 on the daily timeframe. The Ichimoku Kijun level at $166.15 offers immediate support. Momentum remains strong, with MACD flashing a buy signal and ADX supporting a continued buy bias. RSI stands at 71.97, indicating overbought conditions, while Stoch RSI shows the asset as oversold, flagging a divergence among oscillators. CCI aligns with buying sentiment, and Bull/Bear Power points to current dominance by buyers, though the Awesome Oscillator is neutral and does not confirm trend direction.
Consolidation likely with upward bias as resistance nears
Over the next 2–3 sessions, PLTR is likely to trade within a range of $163.7 to $187.74, reflecting a typical volatility band relative to current levels. The base case anticipates continued consolidation in this corridor, with a break above resistance opening the door to further gains. If price loses support at $166.15, a move toward the lower forecasted range may unfold, though upward probability currently outweighs downside risk.
Earlier, analysts noted that Palantir's sustained post-earnings momentum was tempered by emerging regulatory considerations and the prospect of a short-term pullback. The current technical and fundamental setup strengthens this assessment, with overbought signals and a divergence in oscillators underscoring the importance of monitoring the $166.15 support and $187.74 resistance as decisive levels in the days ahead.










-
 Afghanistan
-
 Albania
-
 Algeria
-
 Angola
-
 Argentina
-
 Armenia
-
 Australia
-
 Austria
-
 Azerbaijan
-
 Bahamas
-
 Bahrain
-
 Bangladesh
-
 Belarus
-
 Belgium
-
 Bolivia
-
 Botswana
-
 Brazil
-
 Brunei
-
 Bulgaria
-
 Cambodia
-
 Cameroon
-
 Canada
-
 Chile
-
 China
-
 Colombia
-
 Congo
-
 Costa Rica
-
 Cote d'Ivoire
-
 Croatia
-
 Cuba
-
 Cyprus
-
 Czechia
-
 DR Congo
-
 Denmark
-
 Dominican Republic
-
 Ecuador
-
 Egypt
-
 El Salvador
-
 Estonia
-
 Eswatini
-
 Ethiopia
-
 Finland
-
 France
-
 Georgia
-
 Germany
-
 Ghana
-
 Greece
-
 Haiti
-
 Hong Kong
-
 Hungary
-
 India
-
 Indonesia
-
 Iran, Islamic republic
-
 Iraq
-
 Ireland
-
 Israel
-
 Italy
-
 Jamaica
-
 Japan
-
 Jordan
-
 Kazakhstan
-
 Kenya
-
 Korea
-
 Kuwait
-
 Kyrgyzstan
-
 Laos
-
 Latvia
-
 Lebanon
-
 Lesotho
-
 Libya
-
 Lithuania
-
 Luxembourg
-
 Madagascar
-
 Malaysia
-
 Malta
-
 Mauritius
-
 Mexico
-
 Moldova
-
 Mongolia
-
 Montenegro
-
 Morocco
-
 Mozambique
-
 Myanmar
-
 Namibia
-
 Nepal
-
 Netherlands
-
 New Zealand
-
 Nigeria
-
 North Macedonia
-
 Norway
-
 Oman
-
 Pakistan
-
 Palestine
-
 Panama
-
 Papua New Guinea
-
 Paraguay
-
 Peru
-
 Philippines
-
 Poland
-
 Portugal
-
 Puerto Rico
-
 Qatar
-
 Reunion
-
 Romania
-
 Rwanda
-
 Saudi Arabia
-
 Serbia
-
 Singapore
-
 Slovakia
-
 Slovenia
-
 Somalia
-
 South Africa
-
 Spain
-
 Sri Lanka
-
 Sweden
-
 Switzerland
-
 Syria
-
 Taiwan
-
 Tajikistan
-
 Tanzania
-
 Thailand
-
 Trinidad and Tobago
-
 Tunisia
-
 Turkey
-
 UAE
-
 Uganda
-
 Ukraine
-
 United Kingdom
-
United States
-
 Uruguay
-
 Uzbekistan
-
 Venezuela
-
 Vietnam
-
 Yemen
-
 Zambia
-
 Zimbabwe
- Forex
- Crypto












