

Procter & Gamble stock weekly forecast: Sellers dominate as bearish structure persists beneath long-term averages

Shares of The Procter & Gamble Company (PG) are trading near $144, slipping around 1% over the past week as the setup remains defensive. With sellers maintaining pressure, the backdrop is dominated by fresh corporate actions and ongoing dividend momentum. The defensive bias continues into next week as traders react to a wave of company news and resistance holding overhead.
 163.57
Highlights
- Shares of Procter & Gamble declined 1.01% over the past week to $144.3, trading below major moving averages.
- Technical momentum remains bearish with weak indicators and strong resistance at $144.56 and $147.01 limiting upside attempts.
- The expected trading range for next week is $142.53 to $146.06, with a high probability of further downside while below resistance.
Dividend hike and acquisition news drive sentiment amid executive moves
Procter & Gamble extended its streak of dividend hikes to 70 consecutive years, with the board announcing a 3% increase to the quarterly payout for April 2026, as reported by Yahoo Finance and TheStreet. CNBC reported on August 4, 2026, that PG entered a $3.8 billion agreement to acquire Thorne in a move to grow its Personal Health Care business. Recent SEC filings also highlight new grants of restricted stock units for top executives, while MarketBeat data showed ongoing position changes by institutional holders in the second quarter.
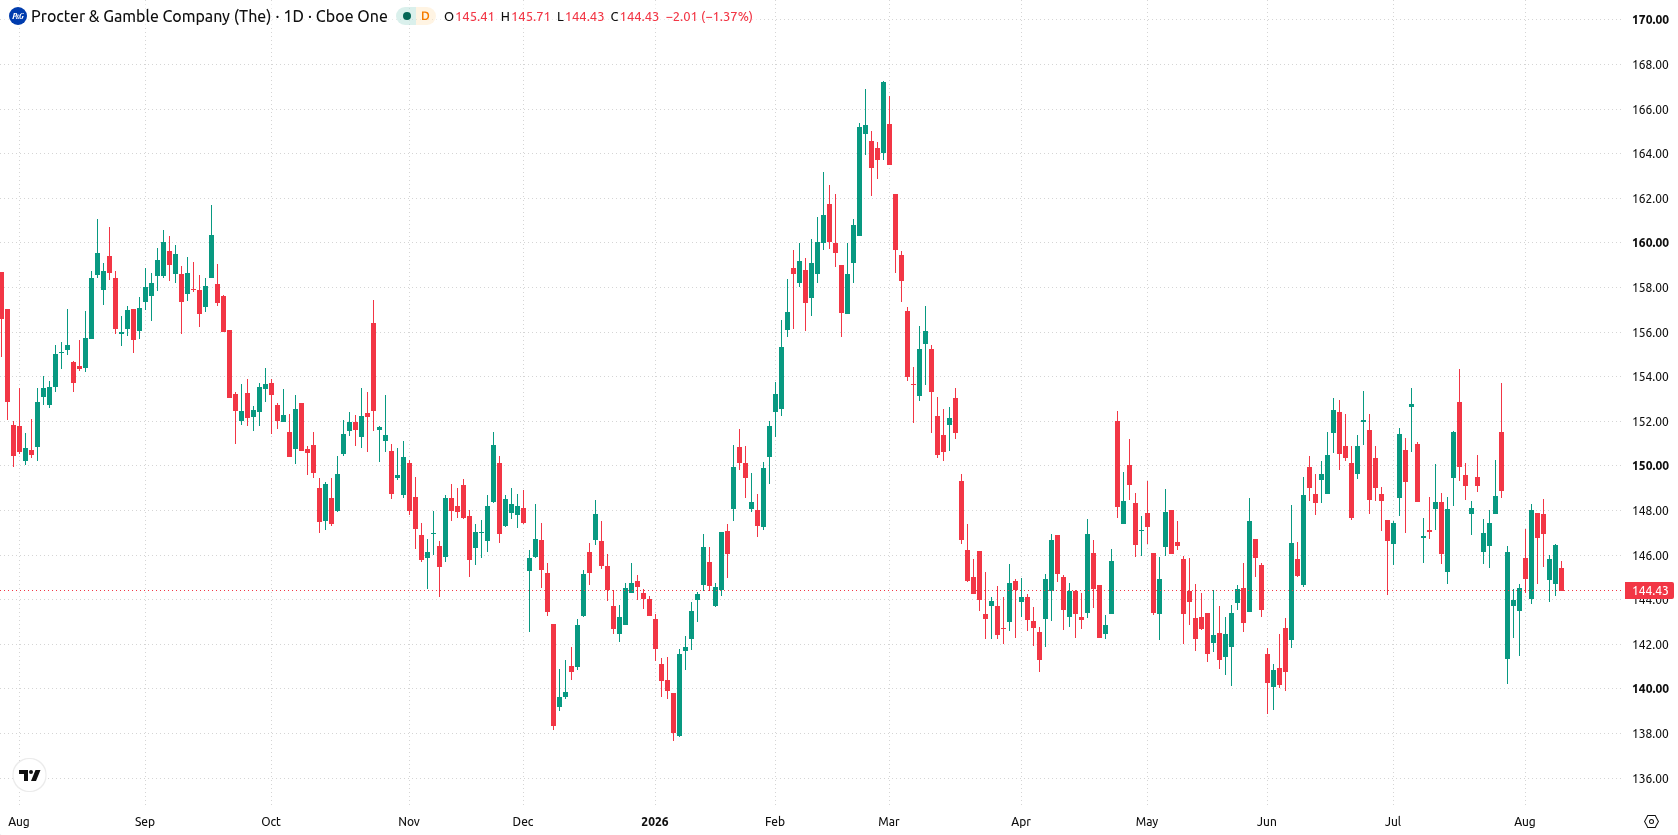
Bearish momentum deepens as resistance caps narrow range over the week
On the daily chart, the setup is biased to the downside with the bearish long-term structure confirmed by the MA-50 remaining under the MA-200. Momentum is weak, as MACD signals "Sell" and Bull/Bear Power reflects "Oversold" conditions, while RSI at 45.23 holds in neutral. The stock is pinned to resistance at $144.56, with volatility ticking up to 2.73%, and the move over the past week has been a contained move within a narrow range. With resistance defined by the weekly low and Ichimoku Kijun at $147.01 capping price action, the outlook remains heavy.
Rangebound trade expected with downside risk dominating next week
Next week, the expected range is $142.53 to $146.06. There is a very low probability (less than 20%) of a rise and a very high probability (more than 80%) of a decline. The base case is for the stock to remain rangebound under $144.56, with sellers likely to dominate as long as resistance holds. A push above $144.56 and the Ichimoku Kijun at $147.01 would be required for any bullish momentum to develop. If price drops below $142.53, further downside could accelerate.
Previously it was reported that Procter & Gamble shares were consolidating with heightened downside risk as persistent selling pressure defined the technical outlook. This article adds new corporate developments and technical signals to reinforce the defensive scenario, with traders advised to monitor resistance at $147.01 as a pivot for any shift in momentum.






Latest Procter & Gamble News





-
 Afghanistan
-
 Albania
-
 Algeria
-
 Angola
-
 Argentina
-
 Armenia
-
 Australia
-
 Austria
-
 Azerbaijan
-
 Bahamas
-
 Bahrain
-
 Bangladesh
-
 Belarus
-
 Belgium
-
 Bolivia
-
 Botswana
-
 Brazil
-
 Brunei
-
 Bulgaria
-
 Cambodia
-
 Cameroon
-
 Canada
-
 Chile
-
 China
-
 Colombia
-
 Congo
-
 Costa Rica
-
 Cote d'Ivoire
-
 Croatia
-
 Cuba
-
 Cyprus
-
 Czechia
-
 DR Congo
-
 Denmark
-
 Dominican Republic
-
 Ecuador
-
 Egypt
-
 El Salvador
-
 Estonia
-
 Eswatini
-
 Ethiopia
-
 Finland
-
 France
-
 Georgia
-
 Germany
-
 Ghana
-
 Greece
-
 Haiti
-
 Hong Kong
-
 Hungary
-
 India
-
 Indonesia
-
 Iran, Islamic republic
-
 Iraq
-
 Ireland
-
 Israel
-
 Italy
-
 Jamaica
-
 Japan
-
 Jordan
-
 Kazakhstan
-
 Kenya
-
 Korea
-
 Kuwait
-
 Kyrgyzstan
-
 Laos
-
 Latvia
-
 Lebanon
-
 Lesotho
-
 Libya
-
 Lithuania
-
 Luxembourg
-
 Madagascar
-
 Malaysia
-
 Malta
-
 Mauritius
-
 Mexico
-
 Moldova
-
 Mongolia
-
 Montenegro
-
 Morocco
-
 Mozambique
-
 Myanmar
-
 Namibia
-
 Nepal
-
 Netherlands
-
 New Zealand
-
 Nigeria
-
 North Macedonia
-
 Norway
-
 Oman
-
 Pakistan
-
 Palestine
-
 Panama
-
 Papua New Guinea
-
 Paraguay
-
 Peru
-
 Philippines
-
 Poland
-
 Portugal
-
 Puerto Rico
-
 Qatar
-
 Reunion
-
 Romania
-
 Rwanda
-
 Saudi Arabia
-
 Serbia
-
 Singapore
-
 Slovakia
-
 Slovenia
-
 Somalia
-
 South Africa
-
 Spain
-
 Sri Lanka
-
 Sweden
-
 Switzerland
-
 Syria
-
 Taiwan
-
 Tajikistan
-
 Tanzania
-
 Thailand
-
 Trinidad and Tobago
-
 Tunisia
-
 Turkey
-
 UAE
-
 Uganda
-
 Ukraine
-
 United Kingdom
-
United States
-
 Uruguay
-
 Uzbekistan
-
 Venezuela
-
 Vietnam
-
 Yemen
-
 Zambia
-
 Zimbabwe
- Forex
- Crypto












