

Anheuser-Busch InBev stock selloff: Downside targets to watch

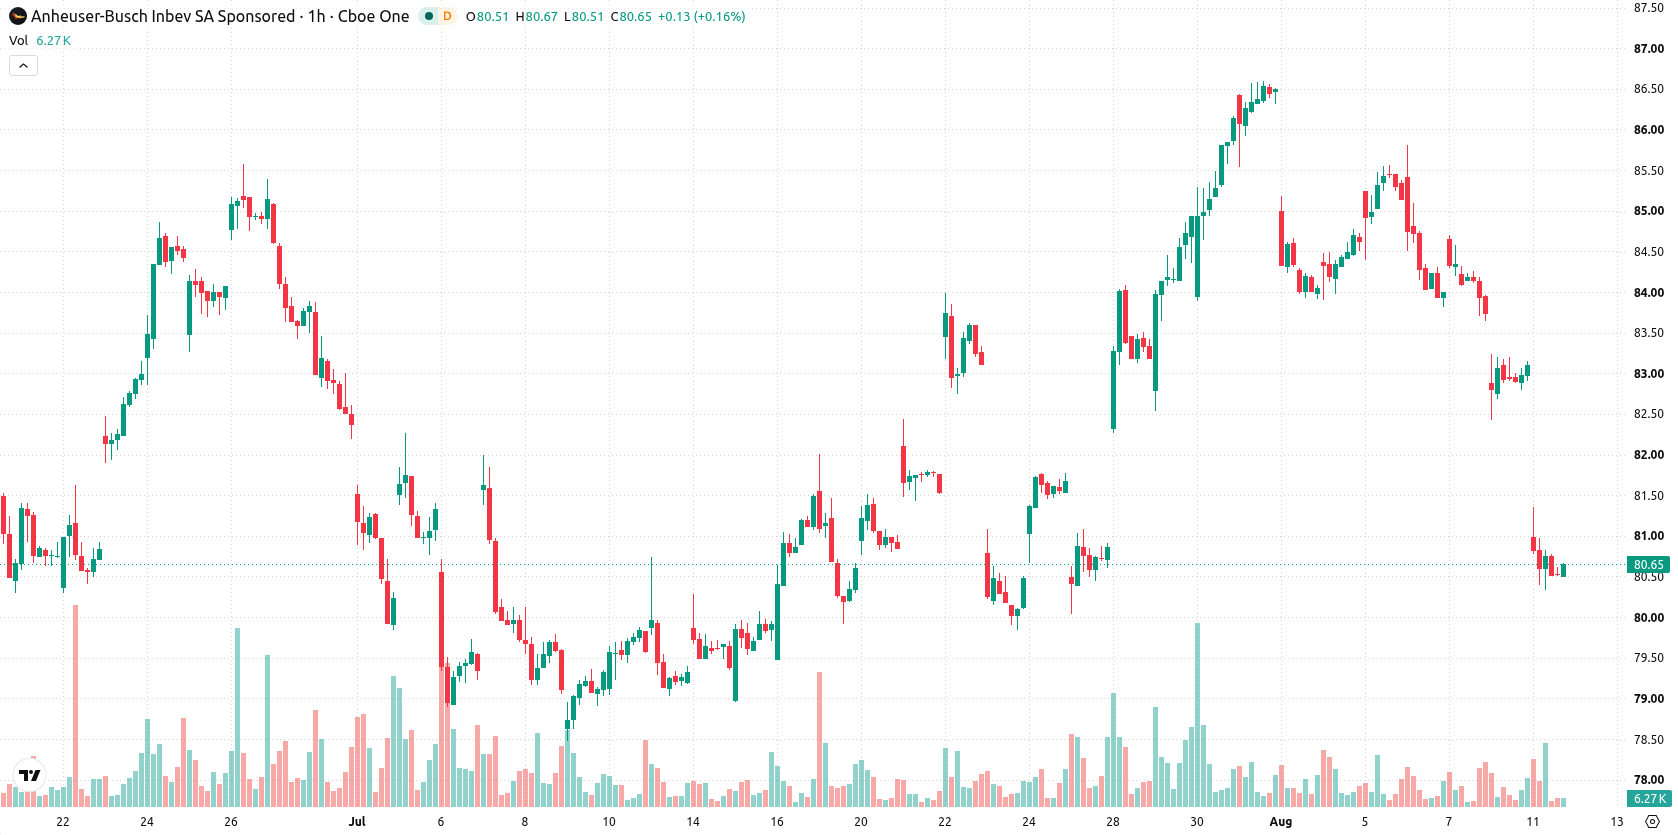
Anheuser-Busch InBev (BUD) stock is trading at $80.61 after a daily decline of 2.99%. The stock currently sits below its major short- and medium-term moving averages, but remains solidly above its long-term average.
 85.08
86.27
Highlights
- BUD/USD trades below key short- and medium-term moving averages, indicating persistent seller pressure over these timeframes.
- Momentum indicators including MACD, ADX, and RSI identify a deeply oversold condition with pronounced downside bias.
- Price finished at $80.61 after a 2.99% drop, with a forecast range of $78.19 to $82.12 and 75% probability of further downside.
Bearish technical signals as intraday selling pressures intensify
On the technical front, BUD is trading below both the MA-20 at $82.84 and MA-50 at $83.99, while still holding above the MA-200 at $73.21. The Ichimoku Kijun indicator identifies immediate resistance at $83.11. Momentum indicators continue to flag sharp selling pressure: MACD and ADX are both signaling a sell bias, and the Awesome Oscillator confirms a bearish outlook. RSI stands at 20.88, with Stoch RSI, CCI, and Bull/Bear Power all registering in deeply oversold territory, consistent with aggressive intraday selling. Price action saw a gap down and closed near the session’s low, with volatility assessed as moderate.
Sideways consolidation favored as bearish risks persist
Looking ahead to the next several sessions, the expected price range is between $78.19 and $82.12, reflecting a typical volatility band relative to current levels. The probability of an upward move stands at 25%, while a downward extension has a 75% likelihood. The baseline scenario is for sideways consolidation within this range; a move above $83.11 would be required to trigger a bullish shift, whereas a drop below $78.19 could accelerate further downside pressure.
Earlier, analysts noted that Anheuser-Busch InBev was exhibiting short-term technical weakness within a broader, structurally bullish long-term trend. The latest technical signals deepen this view by highlighting sustained selling pressure and oversold conditions, making a break below $78.19 the key downside risk to monitor in the coming sessions.






Latest Anheuser-Busch Inbev News




-
 Afghanistan
-
 Albania
-
 Algeria
-
 Angola
-
 Argentina
-
 Armenia
-
 Australia
-
 Austria
-
 Azerbaijan
-
 Bahamas
-
 Bahrain
-
 Bangladesh
-
 Belarus
-
 Belgium
-
 Bolivia
-
 Botswana
-
 Brazil
-
 Brunei
-
 Bulgaria
-
 Cambodia
-
 Cameroon
-
 Canada
-
 Chile
-
 China
-
 Colombia
-
 Congo
-
 Costa Rica
-
 Cote d'Ivoire
-
 Croatia
-
 Cuba
-
 Cyprus
-
 Czechia
-
 DR Congo
-
 Denmark
-
 Dominican Republic
-
 Ecuador
-
 Egypt
-
 El Salvador
-
 Estonia
-
 Eswatini
-
 Ethiopia
-
 Finland
-
 France
-
 Georgia
-
 Germany
-
 Ghana
-
 Greece
-
 Haiti
-
 Hong Kong
-
 Hungary
-
 India
-
 Indonesia
-
 Iran, Islamic republic
-
 Iraq
-
 Ireland
-
 Israel
-
 Italy
-
 Jamaica
-
 Japan
-
 Jordan
-
 Kazakhstan
-
 Kenya
-
 Korea
-
 Kuwait
-
 Kyrgyzstan
-
 Laos
-
 Latvia
-
 Lebanon
-
 Lesotho
-
 Libya
-
 Lithuania
-
 Luxembourg
-
 Madagascar
-
 Malaysia
-
 Malta
-
 Mauritius
-
 Mexico
-
 Moldova
-
 Mongolia
-
 Montenegro
-
 Morocco
-
 Mozambique
-
 Myanmar
-
 Namibia
-
 Nepal
-
 Netherlands
-
 New Zealand
-
 Nigeria
-
 North Macedonia
-
 Norway
-
 Oman
-
 Pakistan
-
 Palestine
-
 Panama
-
 Papua New Guinea
-
 Paraguay
-
 Peru
-
 Philippines
-
 Poland
-
 Portugal
-
 Puerto Rico
-
 Qatar
-
 Reunion
-
 Romania
-
 Rwanda
-
 Saudi Arabia
-
 Serbia
-
 Singapore
-
 Slovakia
-
 Slovenia
-
 Somalia
-
 South Africa
-
 Spain
-
 Sri Lanka
-
 Sweden
-
 Switzerland
-
 Syria
-
 Taiwan
-
 Tajikistan
-
 Tanzania
-
 Thailand
-
 Trinidad and Tobago
-
 Tunisia
-
 Turkey
-
 UAE
-
 Uganda
-
 Ukraine
-
 United Kingdom
-
United States
-
 Uruguay
-
 Uzbekistan
-
 Venezuela
-
 Vietnam
-
 Yemen
-
 Zambia
-
 Zimbabwe
- Forex
- Crypto












